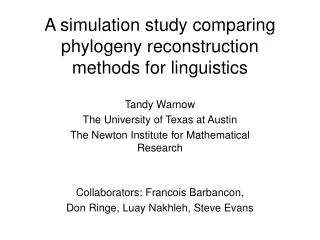
A Simulation Scheme conditioned on data for testing & comparing assessment methods
210 likes | 239 Vues
A Simulation Scheme conditioned on data for testing & comparing assessment methods. José De Oliveira 1 , Doug Butterworth 2 , Anders Nielsen 3 , Timothy Earl 1 , Rebecca Rademeyer 2 , Casper Berg 3 1 Cefas (UK), 2 Maram (South Africa), 3 DTU-Aqua (Denmark). APPROACH TO SIMULATION.

A Simulation Scheme conditioned on data for testing & comparing assessment methods
E N D
Presentation Transcript
A Simulation Scheme conditioned on data for testing & comparing assessment methods José De Oliveira1, Doug Butterworth2, Anders Nielsen3, Timothy Earl1, Rebecca Rademeyer2, Casper Berg3 1Cefas (UK), 2Maram (South Africa), 3DTU-Aqua (Denmark)
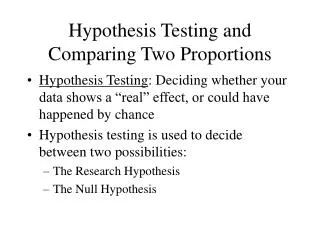
APPROACH TO SIMULATION Difficulty with approaches used previously Generic – so does result apply to MY stock? Thus investigate for actual stocks Base on Management Procedure (MSE) testing protocol developed in IWC Key consideration – robustness to uncertainty Consider alternative plausible scenarios (assessments) which MUST be consistent with available data Apply the “CONDITIONING” concept .
GENERIC VS CASE-SPECIFIC Generic – so does result apply to MY stock? Case-specific conditioning – results apply to MY stock – but can anything be said about other stocks, or any generic inference drawn? Repeat for many stocks to see whether patterns emerge which might justifiably be considered reliable general inferences
CONDITIONING SIMULATIONS Each pseudo dataset is generated from what could be the real underlying dynamics for the stock concerned (as provided by a plausible assessment model), with errors added consistent with the error distributions as estimated in that assessment Two data sets: North Sea herring and cod Three Assessment Models: XSA, SCA, SAM .
ASSESSMENT MODELS XSA - eXtended Survivor Analysis • extension of traditional VPA, tuned to indices of abundance; assumes catches without error • Shepherd 1999, IJMS 56: 584-591 SCA - Statistical Catch-at-Age • allows selectivity blocking, estimated from age composition in the catches and surveys • Rademeyer et al. 2008, AJMS 30(2): 263-290 SAM - State-space Assessment Model • time-varying selectivity, with F as a stochastic process (random effects), and process variances estimated • Nielsen & Berg 2014, Fish Res 158: 96-101
ASSESSMENT MODELS North Sea Herring SSB R Fbar North Sea Cod SSB R Fbar
TWO TEST TYPES: SELF/CROSS PERFORMANCE COMPARISON PLOT Rows :“Truth” as provided by a model Columns:Estimates from the model applied to pseudo-data Cell contents: Performance statistic: SSB, F and R [Most pertinent would be the catch under the intended harvest strategy] . .
NORTH SEA HERRING - SSB XSA on... SCA on... SAM on... ...data generated from XSA fit Cross Tests ...data generated from SCA fit Self-Tests ...data generated from SAM fit Cross Tests
TWO TEST TYPES: SELF/CROSS PERFORMANCE COMPARISON PLOT Rows :“Truth” as provided by a model Columns:Estimates from the model applied to pseudo-data Cell contents: Performance statistic, here SSB . SELF TEST: Diagonals How well does the model estimate itself . CROSS TEST: Off-diagonals How well does it estimate other models . .
NORTH SEA HERRING - SSB XSA on... SCA on... SAM on... ...data generated from XSA fit ...data generated from SCA fit ...data generated from SAM fit
NORTH SEA HERRING - R XSA on... SCA on... SAM on... ...data generated from XSA fit ...data generated from SCA fit ...data generated from SAM fit
NORTH SEA HERRING - Fbar XSA on... SCA on... SAM on... ...data generated from XSA fit ...data generated from SCA fit ...data generated from SAM fit
NORTH SEA HERRING - bias XSA on... SCA on... SAM on... ...data generated from XSA fit ...data generated from SCA fit ...data generated from SAM fit bias = average of (S-T)/T over years and pseudo data sets
NORTH SEA HERRING - rmse XSA on... SCA on... SAM on... ...data generated from XSA fit ...data generated from SCA fit ...data generated from SAM fit rmse = standard deviation of (S-T)/T over years and pseudo data sets
NORTH SEA HERRING - score • Scoring: • For each “reality” how well does each model capture the dynamics [bias, rmse] for SSB, R and Fbar? • Best=2, 2nd Best=1, Worst=0
NORTH SEA COD - SSB XSA on... SCA on... SAM on... ...data generated from XSA fit ...data generated from SCA fit ...data generated from SAM fit
NORTH SEA COD – SCA selectivity SSB Selectivity • SCA forces sloped selectivity • Statistically significant improvement in fit (likelihood ratio test), compared to forcing flat selectivity • XSA forces flat selectivity • SAM is more flexible
CONCLUSIONS • Work in progress (e.g. scoring system used is crude)! • Approach allows consistency check (self-tests) and robustness testing (cross-tests) • Approach informs how to improve models • e.g. may choose alternative method for handling selectivity estimation in SCA • strict adherence to AIC-type criteria does not necessarily lead to the most robust approach • Based on the two case studies • all models performed well on self-tests • cross-tests provided the key discrimination power • SAM appears the most robust of the three methods tested
FUTURE WORK • Expand to other case studies • strengthen the case for generality • Include other assessment models • Consider other performance statistics (e.g. catch under intended harvest strategy) • what matters in the end is the advice • Refine the scoring methodology • e.g. account for similar methods
Thank you for your attention With acknowledgements to other participants in the ICES Methods Working Group and SISAM who assisted in developing this framework