Download
1 / 37
480 likes | 1.25k Vues
PHASE TRANSITIONS AND CRITICAL PHENOMENON. Phase Transitions. Conditions for phase equilibrium. First order Phase Transition: Clausius - Clayperon equation. Second order phase transition. The critical indices. The law of corresponding states. Phase Transitions.

E N D
PHASE TRANSITIONS AND CRITICAL PHENOMENON Phase Transitions Conditions for phase equilibrium First order Phase Transition: Clausius - Clayperon equation Second order phase transition The critical indices The law of corresponding states Presentation by Dr. K.Y. Rajpure
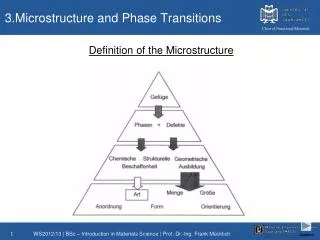
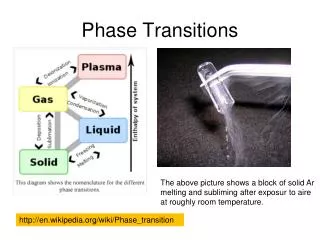
Phase Transitions sharp Bragg reflection - ordered arrangement of atoms or molecules rigid Solid Liquid Matter fluid no long range order Gases Phase transition Transition of a matter from one phase to another, which coexists with the first. • Change in mutual arrangement of molecules • Change in thermodynamical properties of the system Presentation by Dr. K.Y. Rajpure
Phase transition points • Solid - liquid: melting point • Liquid - Vapour: boiling point • Solid - Vapour: sublimation point Three phases in equilibrium - at definite T and P Line OA - melting boundary Line OB - sublimation boundary Line OC - boiling (saturation) boundary Presentation by Dr. K.Y. Rajpure
Melting Curve Melting Vaporization Freezing Condensation Saturation Curve Sublimation Deposition Sublimation Curve Presentation by Dr. K.Y. Rajpure
Phase transition points Saturation curve: terminates at C; Critical point . O; Triple point Presentation by Dr. K.Y. Rajpure
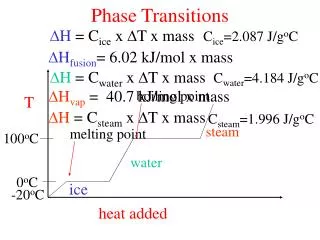
Types of phase transition • First order – • Discontinuous change of int. energy and sp. Volume • Heat evolved / absorbed • e.g. Solid – Liquid, Liquid – Gas • Second order – • Smooth change of int. energy and sp. Volume • No heat evolved / absorbed • e.g. • Iron (Ferromagnetic) – paramagnetic state at Tc • Liquid He I – Liquid He II at T Presentation by Dr. K.Y. Rajpure
Phase 1 N1, U1, V1 Phase 2 N2, U2, V2 Conditions for phase equilibrium System - two phases 1 and 2 at equilibrium For isolated system: Therefore, Presentation by Dr. K.Y. Rajpure
In thermodynamics, S = Constant Since From the thermodynamic considerations, we have 1 is the chemical potential. Presentation by Dr. K.Y. Rajpure
Similarly, We have, Presentation by Dr. K.Y. Rajpure
This is possible only when the coefficients of U1, V1 and m1 vanish individually. Thus if two phases are in equilibrium; temperatures, pressures, and chemical potentials of these phases must be equal. Presentation by Dr. K.Y. Rajpure
We know that G (T, P, N ) = N G (T, P ) Where N: is the number of particles and G (T, P ): Gibb’s free energy per particle Also G = N (From GCE theory) So if 1 = 2 G1 = G2 If the chemical potentials are expressed as the functions of pressure and temperature then, 1(P, T) = 2(P, T) Equivalently, the molar Gibb's free energies of the two phases are equal i.e. G1(P, T) = G2(P, T) Presentation by Dr. K.Y. Rajpure
G1(P, T) = G2(P, T) Which defines the curve in the (P, T) as shown. At a point on the curve the Gibb's free energies of two phases are same. Two phases can't be in equilibrium with each other at all pressures and temperatures. Presentation by Dr. K.Y. Rajpure
First order Phase Transition: Clausius - Clayperon equation Presentation by Dr. K.Y. Rajpure
(a) G Phase 2 Phase 1 T T0 (b) U Phase 1 Phase 2 T (c) S Phase 1 Phase 2 T (d) CP Fig. The variation of G, , S and CP during the first order transition Phase 1 Phase 2 T Presentation by Dr. K.Y. Rajpure
Lets make Taylor series expansion of g: since and where - molar volume & s - the molar entropy Clausius - Clayperon equation Presentation by Dr. K.Y. Rajpure
Ba O Ti Second order Phase Transition A phase transition of the second order is continuous in the sense that the state of the system changes continuously, but symmetry changes discontinuously at the transition point. In case of the transition between different crystal modifications, there is a sudden rearrangement of the crystal lattice and the state of the system changes discontinuously. CubiclatticeofBaTiO3 Presentation by Dr. K.Y. Rajpure
Zn Cu Fig. (a) Fig. (b) Presentation by Dr. K.Y. Rajpure
Consider phase transition between two phases (1 and 2) in equilibrium and let, g = G1G2 Thusg(P, T) = 0 ChangeTby dTandPbydPso as to be in equilibrium, g(P+ dP, T+ dT) = 0 Lets make Taylor series expansion ofg: g is always zero at equilibrium Presentation by Dr. K.Y. Rajpure
For satisfaction of above equation, all the bracketed terms = 0 which leads to the Clausis - Clapeyron equation (Ist order phase transition). When, & individually zero - consider second order terms. Adding two Second order phase transition. Presentation by Dr. K.Y. Rajpure
This corresponds to a phase transition of second order. If such an equality holds for an arbitrary dP and dT , the following conditions must be satisfied: Thus and Presentation by Dr. K.Y. Rajpure
At a second order phase transition, not only the thermodynamic potentials are continuous, but their first derivative (G/P)T and (G/T)P are also continuous; however their second derivatives undergo a jump. Presentation by Dr. K.Y. Rajpure
The critical indices Phase equilibrium curve terminates at C; Critical point Beyond C - No difference of phases Thus at C - Two phases becomes identicalAt C, isotherm has a point of inflexion satisfying From thermodynamics The Critical point is defined as the point where this equality holds. Presentation by Dr. K.Y. Rajpure
The critical indices………... • Many thermodynamic properties - anomalous values near C. • A basic problem - phase transition: to study the anomalous behaviour of a physical system near C. • These anomalies - large density fluctuations characteristic of the critical region. • These fluctuations give rise to singularities in many observable quantities. • The nature of singularities - expressed in terms of a set of critical indices. • Near C, property varies - simple power of the temperature difference from the critical point. Presentation by Dr. K.Y. Rajpure
The critical indices………... The singular behaviour of a physical quantity X is usually described by a simple power law: m - positive number, critical exponent, which is determined by The anomalous behaviour of a number of physical properties can be described by similar power laws. e.g. consider the isothermal compressibility KTdefined by becomes infinity at C. Presentation by Dr. K.Y. Rajpure
The critical indices………... where is a positive constant, called a critical exponent. For T < Tc the divergence of KT can be represented by The critical exponent ' is not necessarily equal to . Presentation by Dr. K.Y. Rajpure
T > Tc Pressure, P C Pc T = Tc T < Tc Vc Volume, V Fig – critical isotherm (i.e. for T = Tc) horizontal tangent C (Vc, Pc) If the position of this line near C is given by P – Pc, then Isotherm for a gas – liquid phase transition Presentation by Dr. K.Y. Rajpure
The critical indices………... If the position of this line near C is given by P - Pc, then • The numerical values of the critical exponents - Identical for all substances. • critical exponents - independent of nature of the substance. • critical exponents below and above Tc - same. Presentation by Dr. K.Y. Rajpure
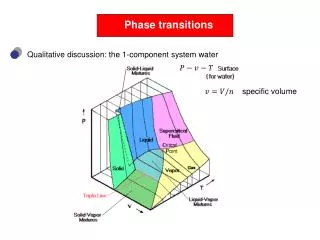
P C Pc T = Tc T < Tc V3 V1 V2 Vc Volume, V The law of corresponding states We know the Van der Waals equation of state This equation has been applied empirically to study the real gases over a wide range of densities and temperature. The Van der Waals curves give maxima and minima in the region represented by a horizontal line in the experimental curve. These maxima and minima points come closer and closer with the rise in temperature. There exist a temperature Tc, called Critical Temperature, at which the kink in the isotherm (i.e. maxima and minima) disappears. The point of inflection is called the Critical point. Presentation by Dr. K.Y. Rajpure
It is only below T < Tc that the Van der Waals equation of state give a kink in an isotherm. For a given P and T < Tc, P has generally three roots in V (e.g. V1, V2 and V3). The critical point for Van der Waals gas can be determined by the equation A By imposing the conditions B See details Equations A and B on solving gives Where Pc, Vc and Tc are respectively known as critical pressure, critical volume and critical temperature Presentation by Dr. K.Y. Rajpure
In terms of Pc, Vc and Tc the Van der Waals equation of state becomes Where How ? Here Pr, Vr and Tr are called as reduced pressure, reduced volume and reduced temperature respectively. Above equation does not contain any constant characteristics of gas and hence, it is a universal equation valid for all substances. This is called the Law of corresponding states. Possible questions Statistical Mechanics: Theory and Applications - S.K. Sinha Chapter No. 10, Page No. 283. Presentation by Dr. K.Y. Rajpure
Thank you . . . . . . . . ! ! Presentation by Dr. K.Y. Rajpure
To find Pc, Vc and Tc: Multiplying equation (b) by Putting this value in equation (b) Subtracting equation (d) from (c) Presentation by Dr. K.Y. Rajpure
Putting values of Vc and Tc in eqn (a) Thus Back Presentation by Dr. K.Y. Rajpure
To show Consider values of V, T and P at critical point We know the Van der Waal’s equation of state If the values of V, T and P are expressed in terms of their critical values by relation Then So that Back Presentation by Dr. K.Y. Rajpure
Explain P-T diagram of one component system. • Distinguish between First and Second order phase transitions. • State and explain conditions for phase equillibrium. • Derive Clausius-Clayperon equation • What do you mean by ‘critical indices’? • What is law of corresponding states. Back Presentation by Dr. K.Y. Rajpure