

SlideServe
Menu
Préférences
© SlideServe · v2026

Phase Transitions

kasa avatar
9 diapositives · 441 Views · Jul 20, 2014

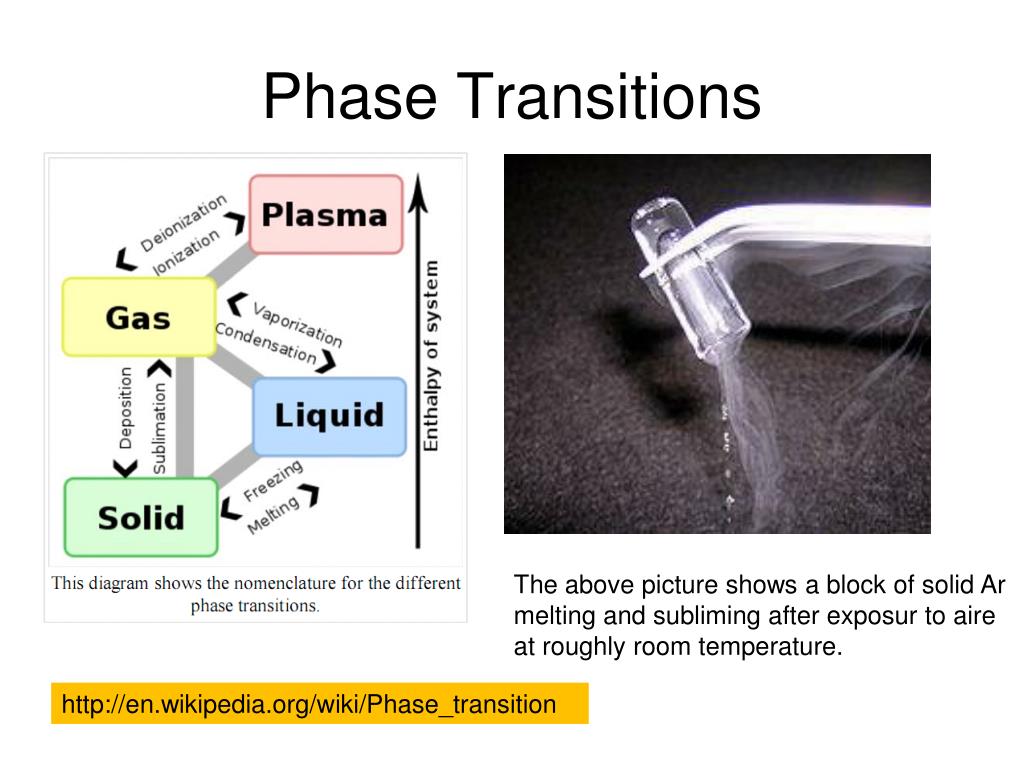
Phase Transitions. The above picture shows a block of solid Ar melting and subliming after exposur to aire at roughly room temperature. . http://en.wikipedia.org/wiki/Phase_transition . Phase Diagram of H 2 O. http://people.virginia.edu/~lz2n/mse209/Chapter9-p1.pdf.
Phase Transitions - slide 1
01 / 9Phase Transitions
1 / 17

Télécharger la présentation

Phase Transitions
Une image / un lien ci-dessous est fourni (tel quel) pour télécharger la présentation

Politique de téléchargement : le contenu du site vous est fourni TEL QUEL pour votre information et votre usage personnel ; il ne peut être vendu, concédé sous licence ni partagé sur d’autres sites sans l’accord de son auteur.Le contenu vous est fourni TEL QUEL, pour votre information et votre usage personnel uniquement. Téléchargez la présentation en cliquant sur ce lien. Lors du téléchargement, si vous ne parvenez pas à télécharger une présentation, l’éditeur a peut-être supprimé le fichier de son serveur.Pendant le téléchargement, si vous ne parvenez pas à obtenir une présentation, le fichier a peut-être été supprimé par l’éditeur.

F I N

Plus de contenu associé

Transcription de la présentation
  1. Phase Transitions The above picture shows a block of solid Ar melting and subliming after exposur to aire at roughly room temperature. http://en.wikipedia.org/wiki/Phase_transition

  2. Phase Diagram of H2O http://people.virginia.edu/~lz2n/mse209/Chapter9-p1.pdf See also: http://www1.lsbu.ac.uk/water/phase.html

  3. Examples Chapter 12 • 4.) A system consists of 1024 molecules of water. The initial state is pure vapor at 373 K and atmospheric pressure. The water is heater at constant pressure to T=700K, subsequently compressed isothermally to a pressure of 230 atm, cooled to 373 K a this constant pressure, and finally allowed to expand isothermally to atmospheric pressure. The final state is pure liquid. • What is the net change in the system’s internal energy? • What is the net change in the system’s chemical potential? • 5). The top of Mt. Everest is 8,854 meters above sea level. Calculate the temperature at which water boils at the summit. • 7). The vapor-pressure curves at the triple point display a cusp (if you look carefully enough, and if the person drawing the diagram was careful enough). Explain why this must be the case. • a). Specifically, near the triple point for water vg/vl=2.06x105vs/vl=1.09 and the latent heats are 0.47, 0.53 and 0.062 eV/molecule (for vaporization, sublimation and melting respectively).

  4. From J.R. Waldram “The Theory of Thermodynamics”

  5. Alloy phase diagram of Cu-Ni http://people.virginia.edu/~lz2n/mse209/Chapter9-p1.pdf

  6. Eutectic Phase Diagram NOTE: at a given overall composition (say: X), both the relative amounts of the two phases (a,b or c,d) AND the composition of one (or possibly both) depend on the temperature http://www.tulane.edu/~sanelson/geol212/2compphasdiag.html