Half-Life
Explore the random nature of radioactive decay and the concept of half-life. Learn to determine half-lives from graphs and understand the implications in real-world applications. Engage in interactive activities to grasp the concept with ease.

Half-Life
E N D
Presentation Transcript
04 January 2020 Half-Life Objectives Be able to describe the random nature of radioactive decay, define the term half-life and determine it from graphs. Thunk: If god made us all the same, are we really different? If atoms of the same element are the same – can they behave differently?
OUTCOMES • ALL MUST be able to state that radioactive decay is random and describe analogies that also display half-lives. • MOST SHOULD be able to define the term Half-Life. • SOME COULD use graphs to determine half lives and explain why certain radioactive materials are used for certain things depending on their half-life.
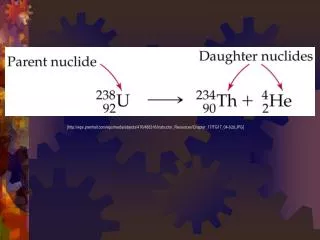
Radioactive decay is random …we may not be able to say which atom will decay but we can say how long it will take for half of them to… this is called the HALF LIFE…
What does Half-Life mean and what things have half-lives? • Popcorn? http://www.youtube.com/watch?v=pnlO_5NLkbg
= radioisotope = new atom formed Half life The HALF-LIFE of an atom is the time taken for HALF of the radioisotopes in a sample to decay… After 2 half lives another half have decayed (12 altogether) After 3 half lives another 2 have decayed (14 altogether) After 1 half life half have decayed (that’s 8) At start there are 16 radioisotopes
A radioactive decay graph Count Time 1 half life
10 MINUTES!! Radioactive ½ Life Dice • You have 50 dice. • Plot this on your graph (roles=0, dice left=50). • Role the dice and put the number that are yellow to one side. • Count the number of dice you have left and plot this number on your graph. (e.g. roles=1, dice left =42.) • Repeat steps 3 and 4 until there are no dice left. • Collect all the dice and put them back in the beaker – then put them on the side bench out of the way.
15 MINUTES!! Analysis a) (A) Draw a smooth curve through the points. (don’t do dot to dot – draw a line of best fit) b) (A) Work out the half life number of roles. i.e. You started with 50 dice so find the number of roles it took to go down to 25 dice. Write this down. c) (M) In real radioactivity we don’t have dice – what do these represent? d) (M) What does the number of roles represent? e) (S) What could we do to make your graph smoother and more reliable? f) (A) Do exam question 6 (the one that is on this slide!!!)
10 MINUTES!! Resourceful Use page 265 of the exercisebook to answer questions 4, 5 and 6
Mary + Mary = Answer: Summary
Stand up – Sit Down • Outcomes: What can you do? • ALL MUST be able to state that radioactive decay is random and describe analogies that also display half-lives. • MOST SHOULD be able to define the term Half-Life. • SOME COULD use graphs to determine half lives and explain why certain radioactive materials are used for certain things depending on their half-life. • Lets see!!
Stand up. DO NOT SAY ANYTHING (think the answers in your head…) Sit down when you can’t do the following: (I WILL CHECK AT THE END!!) Is Radioactive Decay Random? Give an example of something that has a half life Define the term Half Life Find the half life of the graph JOKE!! In seconds!! Explain why the Activity doesn’t go lower than 6 counts per second on the graph Give 2 examples: one of a use of radioactivity that would want a short and one for a long half life WELL DONE!!
PLTS • Pick one of the skills and explain how you have used it today… • Pick one of the skills and explain how you have improved it today… • 3) Pick one of the skills and explain how you will aim to use it or improve it next time… Independent Enquirer Creative Thinker Team Worker Self Manager Reflective Learner Effective Participator