Half-life
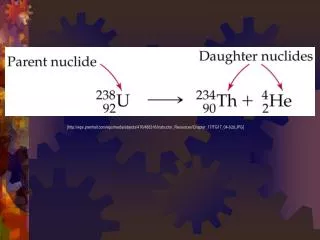
In the iodine clock reaction, there are really two processes happening simultaneously. The first is a slow reaction producing iodine: H 2 O 2 (aq) + 2 I - (aq) I 2 (s ) + 2 OH - (aq)

Half-life
E N D
Presentation Transcript
In the iodine clock reaction, there are really two processes happening simultaneously. The first is a slow reaction producing iodine: H2O2 (aq) + 2 I- (aq) I2 (s) + 2 OH- (aq) However, the iodine is never seen because of the second very fast process in which it is immediately reduced back to colorless iodide ion: I2 (s) + 2 S2O32- (aq) 2 I- (aq) + S4O62- (aq) Thus, iodine is slowly formed and then instantly converted back to iodide ion until all the thiosulfate ion (S2O32-) is used up. At that point the iodine concentration shoots up and the intense blue color of the starch-iodine complex appears.
The time required to reach this point depends on the rates of the two reactions, and consequently on the concentrations of all the reactants. Anything that accelerates the first reaction will shorten the time. This increasing the concentration of iodide, hydrogen peroxide, or acid (it neutralizes the hydroxide ion) will make T shorter. On the other hand, increasing the thiosulfate concentration will have the opposite effect; it will take longer for the iodine color to appear.
In one half-life the amount of reactant decreases by one-half. Substituting into the first-order concentration-time equation, we get: Half-life • The half-life of a reaction is the time required for the reactant concentration to decrease to one-half of its initial value. • For a first-order reaction, the half-life is independent of the initial concentration of reactant.
Half-life • The half-life of a reaction is the time required for the reactant concentration to decrease to one-half of its initial value. • Solving for t1/2we obtain: • Figure 14.8 illustrates the half-life of a first-order reaction.
Figure 14.8: A graph illustrating that the half-life of a first-order reaction is independent of initial concentration. Half life, t1/2, is the time it takes for the [R] to decrease by 1/2. This is exactly like radioactive decay.
Substitute the value of k into the relationship between k and t1/2. Half-life • Sulfuryl chloride, SO2Cl2, decomposes in a first-order reaction to SO2 and Cl2. • At 320 oC, the rate constant is 2.2 x 10⁻⁵ s-1. What is the half-life of SO2Cl2 vapor at this temperature?
Half-life • Sulfuryl chloride, SO2Cl2, decomposes in a first-order reaction to SO2 and Cl2. • At 320 oC, the rate constant is 2.20 x 10⁻⁵ s-1. What is the half-life of SO2Cl2 vapor at this temperature? • Substitute the value of k into the relationship between k and t1/2.
Half-life • Sulfuryl chloride, SO2Cl2, decomposes in a first-order reaction to SO2 and Cl2. • At 320 oC, the rate constant is 2.20 x 10⁻⁵ s-1. What is the half-life of SO2Cl2 vapor at this temperature? • Substitute the value of k into the relationship between k and t1/2.
Again, assuming that [A]t = ½[A]o after one half-life, it can be shown that: Half-life • For a second-order reaction, half-life depends on the initial concentration and becomes larger as time goes on. • Each succeeding half-life is twice the length of its predecessor.
Collision Theory • Rate constants vary with temperature. Consequently, the actual rate of a reaction is very temperature dependent. • Why the rate depends on temperature can by explained by collision theory.
Collision Theory • Collision theory assumes that for a reaction to occur, reactant molecules must collide with sufficient energy and the proper orientation. • The minimum energy of collision required for two molecules to react is called the activation energy, Ea.
KMnO4 + H2C2O4 (oxalic acid) Figure 14.11: Two test tubes containing the same solution,one in water. Photo courtesy of American Color.
KMnO4 + H2C2O4 (oxalic acid) CO2+ H2O Figure 14.11: One test tube shows a reaction while theother does not. Photo courtesy of American Color.
Transition-State Theory • Transition-state theory explains the reaction resulting from the collision of two molecules in terms of an activated complex. • An activated complex (transition state) is an unstable grouping of atoms that can break up to form products. • A simple analogy would be the collision of three billiard balls on a billiard table.
Transition-State Theory • Transition-state theory explains the reaction resulting from the collision of two molecules in terms of an activated complex. • Suppose two balls are coated with a slightly stick adhesive. • We’ll take a third ball covered with an extremely sticky adhesive and collide it with our joined pair.
Transition-State Theory • Transition-state theory explains the reaction resulting from the collision of two molecules in terms of an activated complex. • The “incoming” billiard ball would likely stick to one of the joined spheres and provide sufficient energy to dislodge the other, resulting in a new “pairing.” • At the instant of impact, when all three spheres are joined, we have an unstable transition-state complex.
Transition-State Theory • Transition-state theory explains the reaction resulting from the collision of two molecules in terms of an activated complex. • If we repeated this scenario several times, some collisions would be successful and others (because of either insufficient energy or improper orientation) would not be successful. • We could compare the energy we provided to the billiard balls to the activation energy, Ea.
Figure 14.12: Importance of molecular orientation in the reaction of NO and CI2.
Potential-Energy Diagrams for Reactions • To illustrate graphically the formation of a transition state, we can plot the potential energy of a reaction versus time. • Figure 14.13 illustrates the endothermic reaction of nitric oxide and chlorine gas. • Note that the forward activation energy is the energy necessary to form the activated complex. • The DH of the reaction is the net change in energy between reactants and products.
Figure 14.13 Potential-energy curve for the endothermic reaction of nitric oxide and chlorine.
Potential-Energy Diagrams for Reactions • The potential-energy diagram for an exothermic reaction shows that the products are more stable than the reactants. • Figure 14.14 illustrates the potential-energy diagram for an exothermic reaction. • We see again that the forward activation energy is required to form the transition-state complex. • In both of these graphs, the reverse reaction must still supply enough activation energy to form the activated complex.
Figure 14.14 Potential-energy curve for an exothermic reaction.
Collision Theory and the Arrhenius Equation • Collision theory maintains that the rate constant for a reaction is the product of three factors. • Z, the collision frequency • f, the fraction of collisions with sufficient energy to react • p, the fraction of collisions with the proper orientation to react
or Collision Theory and the Arrhenius Equation • Z is only slightly temperature dependent. • This is illustrated using the kinetic theory of gases, which shows the relationship between the velocity of gas molecules and their absolute temperature.
Collision Theory and the Arrhenius Equation • Z is only slightly temperature dependent. • This alone does not account for the observed increases in rates with only small increases in temperature. • From kinetic theory, it can be shown that a 10 oC rise in temperature will produce only a 2% rise in collision frequency.
It can be shown thatfis related to Ea by the following expression. Collision Theory and the Arrhenius Equation • On the other hand, f, the fraction of molecules with sufficient activation energy, turns out to be very temperature dependent. • Here e = 2.718… , and R is the ideal gas constant, 8.31 J/(mol.K).
Collision Theory and the Arrhenius Equation • On the other hand, f, the fraction of molecules with sufficient activation energy turns out to be very temperature dependent. • From this relationship, as temperature increases, f increases. • Also, a decrease in the activation energy, Ea, increases the value of f.
Collision Theory and the Arrhenius Equation • On the other hand, f, the fraction of molecules with sufficient activation energy turns out to be very temperature dependent. • This is the primary factor relating temperature increases to observed rate increases.
Collision Theory and the Arrhenius Equation • The reaction rate also depends on p, the fraction of collisions with the proper orientation. • This factor is independent of temperature changes. • So, with changes in temperature, Z and p remain fairly constant. • We can use that fact to derive a mathematical relationship between the rate constant, k, and the absolute temperature.
The Arrhenius Equation • If we were to combine the relatively constant terms, Z and p, into one constant, let’s call it A. We obtain the Arrhenius equation: • The Arrhenius equation expresses the dependence of the rate constant on absolute temperature and activation energy.
Taking the natural logarithm of both sides of the equation, we get: The Arrhenius Equation • It is useful to recast the Arrhenius equation in logarithmic form.
The Arrhenius Equation • It is useful to recast the Arrhenius equation in logarithmic form. • We can relate this equation to the (somewhat rearranged) general formula for a straight line. y = b + m x • A plot of ln k versus (1/T) should yield a straight line with a slope of (-Ea/R) and an intercept of ln A. (see Figure 14.15)
The two equations describing the relationship at each coordinate would be and The Arrhenius Equation • A more useful form of the equation emerges if we look at two points on the line this equation describes that is, (k1, (1/T1)) and (k2, (1/T2)).
We can eliminate ln A by subtracting the two equations to obtain The Arrhenius Equation • A more useful form of the equation emerges if we look at two points on the line this equation describes that is, (k1, (1/T1)) and (k2, (1/T2)).