Waiting Line Theory
170 likes | 338 Vues
Learn about queuing theory, waiting line costs, structure of waiting line systems, and analytical formulas for various queuing systems with examples and applications in different scenarios.

Waiting Line Theory
E N D
Presentation Transcript
Waiting Line Theory Akhid Yulianto, SE, MSc (log)
Waiting Line Examples Situation Arrivals Servers Service Process Bank Customers Teller Deposit etc. Doctor’s Patient Doctor Treatmentoffice Traffic Cars Light Controlledintersection passage Assembly line Parts Workers Assembly Tool crib Workers Clerks Check out/in tools
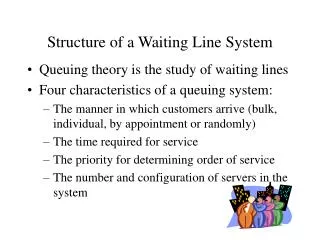
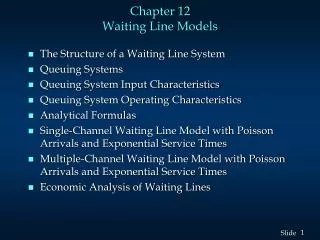
Structure of a Waiting Line System • Queuing theory is the study of waiting lines. • Four characteristics of a queuing system are: • the manner in which customers arrive • the time required for service • the priority determining the order of service • the number and configuration of servers in the system.
Waiting Line Costs Cost Total waiting line cost Service cost Waiting time cost Level of service Optimal
Structure of a Waiting Line System • Distribution of Arrivals • Generally, the arrival of customers into the system is a random event. • Frequently the arrival pattern is modeled as a Poisson process. • Distribution of Service Times • Service time is also usually a random variable. • A distribution commonly used to describe service time is the exponential distribution.
Poisson Probability • x = Tingkat kedatangan • λ = rata rata kedatangan per periode • e = 2.71828
Eksponential Probability • µ =jumlah unit yang di layani per periode • e = 2.71828
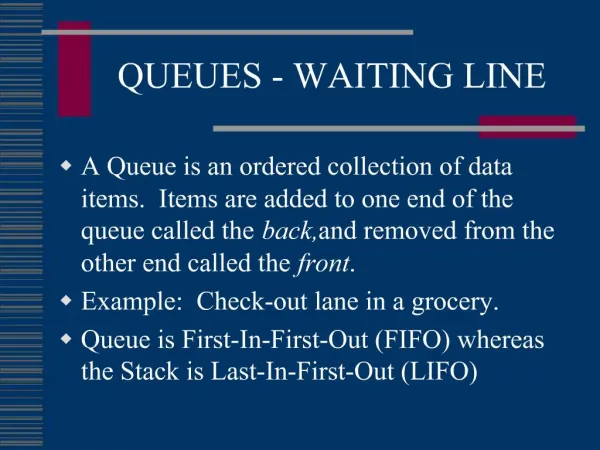
Structure of a Waiting Line System • Queue Discipline • Most common queue discipline is first come, first served (FCFS). • An elevator is an example of last come, first served (LCFS) queue discipline. • Other disciplines assign priorities to the waiting units and then serve the unit with the highest priority first.
Structure of a Waiting Line System System Waiting line Customer arrives Customer leaves S1 System S1 Waiting line Customer arrives Customer leaves S2 S3
Queuing Systems • A three part code of the form A/B/k is used to describe various queuing systems. • A identifies the arrival distribution, B the service (departure) distribution and k the number of channels for the system. • Symbols used for the arrival and service processes are: M - Markov distributions (Poisson/exponential), D - Deterministic (constant) and G - General distribution (with a known mean and variance). • For example, M/M/k refers to a system in which arrivals occur according to a Poisson distribution, service times follow an exponential distribution and there are k (sometimes others say s) servers working at identical service rates.
Queuing System Input Characteristics = the average arrival rate 1/ = the average time between arrivals µ = the average service rate for each server 1/µ = the average service time = the standard deviation of the service time
Analytical Formulas • For nearly all queuing systems, there is a relationship between the average time a unit spends in the system or queue and the average number of units in the system or queue. • These relationships, known as Little's flow equations are: L = W and Lq = Wq
Analytical Formulas • When the queue discipline is FCFS, analytical formulas have been derived for several different queuing models including the following: • M/M/1 • M/M/k • M/G/1 • M/G/k with blocked customers cleared • M/M/1 with a finite calling population • Analytical formulas are not available for all possible queuing systems. In this event, insights may be gained through a simulation of the system.
M/M/1 • Ls = average number of units in the system (waiting and being served) • Ws = average time a unit spends in the system • Lq = average number of units waiting in the queue • Wq = Average time a unit spends waiting in the queue • Utilization factor for the system • Probability of 0 units in the system • Probability of more than k units in the system, where n is the number of units in the system
M/M/k Queuing System • Multiple channels (with one central waiting line) • Poisson arrival-rate distribution • Exponential service-time distribution • Unlimited maximum queue length • Infinite calling population • Examples: • Four-teller transaction counter in bank • Two-clerk returns counter in retail store
M/M/S • Ls = average number of units in the system (waiting and being served) • Ws = average time a unit spends in the system • Lq = average number of units waiting in the queue • Wq = Average time a unit spends waiting in the queue • Probability of 0 units in the system