Download
1 / 34
340 likes | 520 Vues
Traffic Safety Improvement Program (TSIP). Saleem M. Syed, P.E, Principal Engineer, Port Authority of NY & NJ Krzysztof Lukasik, Associate Engineer, Port Authority of NY & NJ. ATSIP 2016 Traffic Records Forum Baltimore, MD August 9, 2016. Port District.

E N D
Traffic Safety Improvement Program (TSIP) Saleem M. Syed, P.E, Principal Engineer, Port Authority of NY & NJ Krzysztof Lukasik, Associate Engineer, Port Authority of NY & NJ ATSIP 2016 Traffic Records Forum Baltimore, MD August 9, 2016
PA Traffic Safety Improvement Program (TSIP) • Results-oriented, performance-based approach to traffic safety • Collaborative effort between: • Engineering • PAPD • Line Departments • Law Planning Identify & Prioritize crash locations Implementation Design & Construct Improvements Evaluation Assess Effectiveness of Improvements
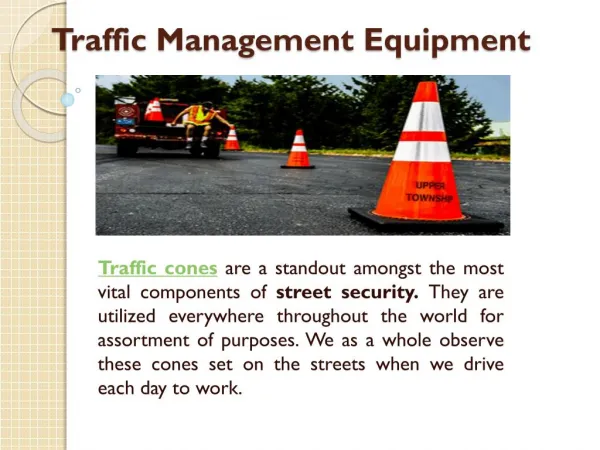
Traffic Safety • Crash Reporting (PA-621) • Crash Data Management • Analysis and Reports • Crash Countermeasure Development • Road Safety Audits of Roadside Features • Speed Management • Traffic Safety Awareness, Education, and Training
2015 Motor Vehicle Crashes • Tunnels, Bridges & Terminals • 64% • +/- 9,500 reports processed in 2015 • Crash Distribution
Performance Since 2000 • 32% overall crash reduction agency-wide
Performance Since 2000 • 45% injury crash reduction agency-wide
Crash Mitigation: From Data to Implementation 3. Crash points are entered and viewed on GIS-based aerial maps and high crash locations are identified. 2. Crash report is scanned and data is entered into CRASH 1. A crash occurs 4. Crash analysis is performed 7. A “Before and After” crash analysis is performed to evaluate the effectiveness of the safety improvements 4. Engineering develops conceptual mitigation plans and coordinates funding and implementation strategy with Line Departments and PMD 6. Engineering designs and implements mitigation measures
Motor Vehicle Crash Reports 2010 99 data fields 290 codes 2000 95 data fields 208 codes 1989 48 data fields 70 codes
Crash Data Flow Diagram • Originals received from Police within 1 to 2 weeks • Logged into CRASH on day of receipt • Public Safety Department • Law Department • Reviewed and verified within 1 week • Traffic Engineering
Data Quality Assurance/Quality Control • +/- 9,500 crashes processed • 6,500 included in crash analysis • 3,000 excluded • Included: incidents that involve motor vehicles while in transport on public Port Authority travelways • Excluded: • Off-property/tenant area • Parked vehicles • AOA (airside operations area) • non-collision events
Crash Locations Dyer Ave • Holland Tunnel • New Jersey Side • Lincoln Tunnel • New York Side
Crash Data Management - Dashboard As of July 6, 2016
Crash Reporting Reports • Quarterly • Annual • As needed
Use of Crash Data Engineering Department • Crash Mitigation Program • Pavement Skid Resistance Program • Road Safety Audit Program Law Department • Claims Against the Port Authority • Damage Cost Recovery Against Motorists Public Safety Department • Administrative (insurance, adjudication) • Enforcement Line Departments • Project Prioritization and Planning
Analysis and Reporting • Crash Severity Method • Prioritizes location based on comprehensive crash costs • Total crash cost = number of crashes X each crash cost Crash Cost Base On Severity Adopted from FHWA • Fatalities are of the highest concern; therefore, are not subject to the prioritization methodology Fatal Crash = $5,180,000 Major Injury Crash = $273,000 Minor Injury Crash = $72,000 Complaint of Pain = $36,000 Prop. Damage Only = $9,000
Crash Analysis and Mitigation – Lincoln Tunnel • Delineator posts were installed to provide safer merging • Flexible and attached to moveable bases
Crash Analysis and Mitigation – Newark Airport • The number of lanes was reduced, allowing for wider lanes • Far left lane was designated as a ‘thru lane’ and restriped with solid lines
Speed Management Port Newark George Washington Bridge Port Newark Lincoln Tunnel
Speed Management LAS JFK – 30 MPH MCO ORD SFO
O&M Standard Update: Establish 25 MPH Work Zone Speed Limit Implemented: Sep 2015
Traffic Safety Awareness, Education & Training Implemented April 2015 for Distracted Driver Awareness Month
Thank You QUESTIONS? Visit us at: www.panynj.gov follow@panynj www.instagram.com/panynj www.facebook.com/panynj www.linkedin.com/company/port-authority-of-ny-&-nj