Download
1 / 41
450 likes | 580 Vues
Explore the generated graphics using Model 41 with 41 electrodes, showcasing buried targets at varying depths and conductivities. Discover values used for Clay/Sand slides and interpretations from inversion modeling using Wenner arrays at different spacings.

E N D
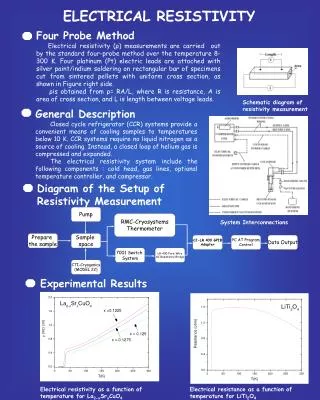
Electrical Resistivity Lab HWR 532 Josh Clemons
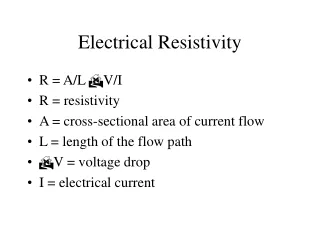
The following graphics were generated using “Model 41” consisting of 41 electrodes spaced 1 meter apart with 4 nodes per electrode spacing.
2 Targets, Different rSmall, high r target above large, low r target
Note how the following two graphics are almost identical, although the underground situation is different. The small target below the large target is virtually invisible.
2 Targets, Different rSmall, high r target below large, low r target
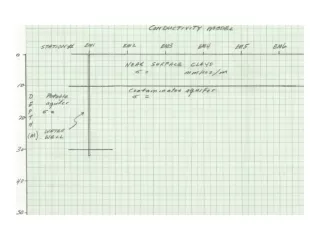
Values Used for Clay/Sand Slides • EC of water = 800 mmho/cm • Porosity of sand = 0.4 • Porosity of clay = 0.45 • Archie equation: ECbulk = (ECwater)(water content)2(porosity)1.2
Notice in the following four slides that it is difficult to tell the difference between various water contents in the same beds.
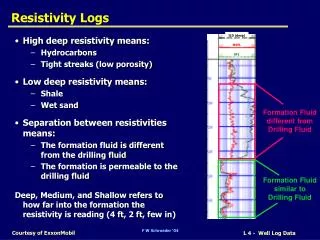
Inversion ModelingWenner array, 1 m spacing • RMS error after 3 inversions is 29.7% - not very good. • The model indicates a relatively resistive formation or group of formations just below the surface, underlain by less resistive layers.
Inversion ModelingWenner array, 3 m spacing • RMS after 3 inversions is 35.7% - even worse than for the 1 m spacing. • Drawing conclusions from this model would be risky. However, it does appear that there is something relatively resistive just below the surface, underlain by less resistive material.
Inversion ModelingWenner array, 5 m spacing • RMS after 3 inversions is 64.1% - the worst yet. The RMS has increased with electrode spacing for these models. • As with the 3 m spacing, drawing a conclusion is risky. However, the apparent relatively resistive body appears again at right.