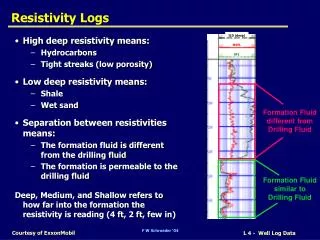
Resistivity Imaging
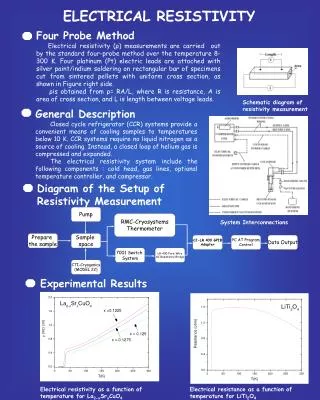
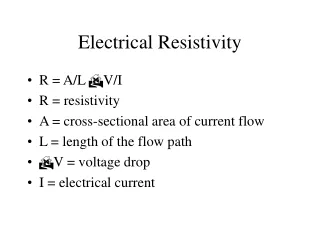
Resistivity Imaging. A Presentation by Advanced Geosciences, Inc. To change picture, left click or wait 15 seconds. Depth Penetration Using the Sting/Swift system, resistivity imaging surveys can be performed to large depths. This


Resistivity Imaging
E N D
Presentation Transcript
Resistivity Imaging A Presentation by Advanced Geosciences, Inc. To change picture, left click or wait 15 seconds
Depth Penetration Using the Sting/Swift system, resistivity imaging surveys can be performed to large depths. This example shows measurements down to approxi- mately 200 meters. Data, courtesy of Geological Survey of Austria.
Cave detection A previously unknown cave, the Sting Cave, was detected with the Sting/Swift system
Cave 1 is a previously known cave. The Sting Cave (Cave 2) was detected during a demonstration survey over Cave 1
The Sting Cave was carefully mapped and named by Mike Warton & Associates
Three important lessons can be learned from the Sting Cave example 1. The resistivity imaging technique is “side-looking” The profile was oriented perpendicular to the screen, and positioned where the entrance hole was drilled. The hole, which was drilled into the center of the anomaly almost missed the cave, which is mainly located to the right of the profile
Three important lessons can be learned from the Sting Cave example 2. The resistivity image may be “distorted” by unknown formations. The Sting Caveappers larger than Cave 1 even though it in reality is smaller. The limestone in the area is horizontally layered and less competent layers have been eroded under the main cave. These eroded layers are less than a meter in thickness, but prevents the current to pass through the rock and thereby magnifies the shape of the cave in the resistivity image.
Three important lessons can be learned from the Sting Cave example 3. The resistivity image is a picture in terms of electrical resistivity and not a true picture as we are used to seeing. The Sting cave (Cave 2) appears to have higher resistivity (darker grey), even though both caves are air- filled. However, Cave 1 has moist stalactites and stalagmites connecting the roof and the ceiling. Therefore current can pass from the roof to the ceiling and make this cave appear more transparent.
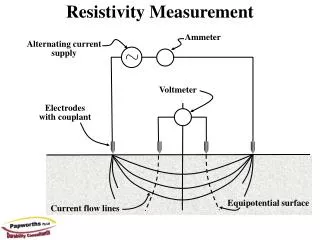
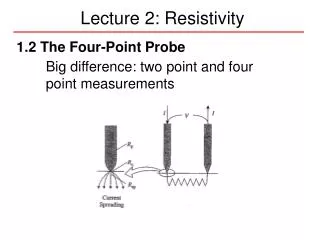
Dipole-dipole gives high resolution, but has the weakest signal. Dipole-dipole electrode array
Schlumberger does not have as high resolution as dipole-dipole but has stronger signal. Schlumberger electrode array
Wenner has poor lateral resolution, but has the strongest signal Wenner electrode array
Conclusion: • Use the dipole-dipole array when the • highest resolution is required • Use the Schlumberger array in • case of electrically noisy conditions • which is often the case under low • resistive conditions such as • landfills and environmental sites • Use the Wenner array as a last • resort, or if you are mapping • basically horizontal layers The profiles above are recorded with three different arrays, keeping the electrodes in the exact same position
Easy and simple to set up and run. The Sting/Swift system comprises the Sting resistivity meter, the Swift interface box and a number of electrode switches. The switches are simply “rubberbanded” to the electrode stakes
Resistivity survey at the Amistad Dam The survey was performed along the embankment on the bottom of the almost dry dam
The dam is leaking under the embankment in the karstic limestone. One of more than 15 concrete plugged holes, where water leaked out of the dam.
Landfill Survey using the Sting/Swift automatic resistivity system, courtesy of SAIC, Middletown Pennsylvania
Site investigation for proposed tunnel, courtesy of Hyundai Construction Company, Korea
Resistivity/GPR survey at historical tree site in El Paso, Texas Objective: to map the root system
Pole-pole 3D command file It is easy to create a pole-pole 3D command file by using the “Create command file” option in the UserLoad software
3D resistivity image Survey (pole-pole) performed over a horizontally layered limestone. Displayed high resistive area is caused by unknown structure within the limestone. 3D presentation, courtesy of “C Tech Development Corp.”
Shallow marine resistivity survey Four Wenner (a=6m) profiles repeated along the same line Trawling data Time from passing the start marker
If you would like to get more information on the electrical resistivity imaging technique or our Sting/Swift, automatic resistivity imaging instrument you can contact us at: Advanced Geosciences, Inc. 10710 D-K Ranch Rd. Austin, Texas 78759 USA Phone +1 512 335-3338 Fax +1 512 258-9958 E-mail agi@agiusa.com Web site http://www.agiusa.com