Mutation, Selection, and Evolution: Understanding Genetic Variation
280 likes | 336 Vues
Explore the concepts of mutation, selection, and evolution in populations through allele frequencies, natural selection, fitness, and genotypic changes.

Mutation, Selection, and Evolution: Understanding Genetic Variation
E N D
Presentation Transcript
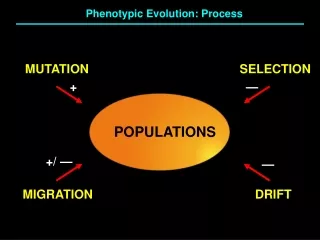
MUTATION SELECTION POPULATIONS MIGRATION DRIFT Phenotypic Evolution: Process + — +/ — —
Assume: a single autosomal locus with 2 alleles. Frequency (A) = p Frequency (a) = q • Suppose that A mutates to a at rate u: A a = u • And a mutates to A at a rate v: a A =v HOW DOES MUTATION CHANGE ALLELE FREQUENCIES?
Change in p by mutation from generation t t + 1: pt+1 = pt (1-u) + qt (v) Since p + q = 1, q = 1 - p we can substitute (1-p) for q: pt+1 = pt (1-u) + (1-pt) (v) A alleles remaining as A a alleles mutating to A
Example: If p and q = 0.5, And u = 0.0001 and v = 0.00001 pt+1 = pt (1-u) + (1-pt) (v) pt+1 = 0.5 (1 - 0.0001) + (1 - 0.5) (0.00001) = 0.499955
At Equilibrium: p x u = q x v, And p = v / (u + v) , q = u / (u + v) If u = 0.0001 and v = 0.00001, p = 0.091 and q = 0.909 However, if p starts out at 1.0, it would take about 40,000 generations to reach p = 0.091!!!
DEFINITION OF SELECTION • Any consistent difference in fitness among phenotypically different biological entities.
SOME IMPORTANT POINTS • Natural selection is not the same as evolution. • Natural selection is different from evolution by natural selection. • Natural selection has no effect unless different phenotypesalso differ in genotype. • Natural selection is variation in average reproductive success (including survival) among phenotypes.
IMPORTANT PARAMETERS FOR STUDYING SELECTION IN MENDELIAN POPULATIONS • Absolute Fitness (W) = Total number of offspring produced = (Probability of survival to maturity) x (mean number of successful gametes) • Relative Fitness = Absolute Fitness (W) / Mean Fitness (W) W = p2WAA + 2p(1-p)WAa +(1-p)2Waa • Selection Coefficient (s) = Fitness disadvantage to homozygous genotype: Waa = 1-s • Dominance Coefficient (h) = Proportion of s applied to the heterozygous genotype: WAa = 1-hs
NATURAL SELECTION OPERATING ON A SINGLE LOCUS Assume: 1) Discrete generations 2) No evolutionary forces other than selection The new frequency of Aallele after selection, p’ = freq(AA after selection) + ½freq(Aa after selection) Box 6.5 in Z&E
Gamete Pool Genotypes Aa A a A Aa AA a A a aa a aa Aa A aa A a A AA Aa a A Gene Frequencies Genotype Frequencies p +q =1 p 2 + 2pq + q 2 = 1 • With random mating the genotype frequencies will be in H-W equilibrium, and the gene frequencies will stay the same from one generation to the next.
Gamete Pool Genotypes Aa A a A Aa AA a A a aa a aa Aa A aa A a A AA Aa a A Gene Frequencies Genotype Frequencies p’ +q’ =1 p + q = 1 p 2 + 2pq + q 2 = 1 Genotypes • New set of gene frequencies AA • Selection changes the genotype frequencies AA AA Aa p ’ = p 2 (WAA / w) + pq (WAa /w) Aa Aa aa q ’ = q 2 (Waa / w) + pq (WAa /w) AA Aa Genotype Frequencies After Selection p 2 (WAA /w) + 2pq (WAa /w) + q 2 (Waa /w) = 1
w = p2wAA + 2p(1-p)wAa +(1-p)2waa CHANGE IN ALLELE FREQUENCIES PER GENERATION
AFTER SOME ALGEBRA… • We can see what happens with various types of selection by substituting explicit values for the allele frequencies and the fitnesses of the different genotypic classes.
CASE 1: ADVANTAGEOUS ALLELE WITH DIFFERING DEGREES OF DOMINANCE FITNESSES: WAA = 1 WAa = 1- hs Waa = 1 - s
THE RATE OF SPREAD OF A FAVORABLE ALLELE DEPENDS ON THE DEGREE OF DOMNINANCE FITNESSES: WAA = 1 WAa = 1- hs Waa = 1 - s h=0.5 h=0 h=1
SELECTION AGAINST A PARTIALLY RECESSIVE LETHAL (s = 1) FITNESSES: WAA = 1 WAa = 1- hs =1 – h Waa = 1 – s = 0 (Complete Dominance) (Partial Dominance)
Decline in frequency of a lethal recessive allele Corresponding increase in frequency of the dominant allele Fig. 5.16 F & H
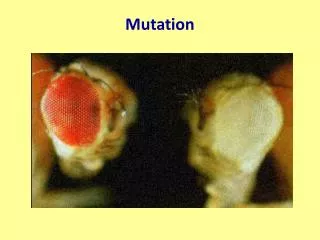
SINGLE LOCUS SELECTION Case Study: Industrial Melanism Biston betularia • Frequencies of melanic and peppered forms of the moth in different parts of Britain. From Less (1971)
Mean Winter SO2 Carbonaria Morph (%) Year Peppered Morph RESPONSE TO A CHANGE IN SELECTION: carbonaria Morph FROM: Bishop & Cook 1980
ESTIMATING SELECTION: MARK – RECAPTURE EXPERIMENT • Frequencies of three peppered moth forms in a sample from Birmingham. The observed numbers are the actual numbers recaught; the expected numbers are the numbers that would have been recaught if all forms survived equally. Data from Kettlewell (1973). Numbers Recaptured
SELECTION AND DOMINANCE COEFFICIENTS GenotypeAbsolute fitness scaled to 1.0 cc 0.43 Wcc = 1-s Cc 0.81 WCc = 1-hs CC 1.00 WCC = 1 • Selection Coefficient (against homozygotes): s = 1 – 0.43 = 0.57 • Dominance Coefficient: hs = 1 - 0.81 = 0.19 h = 0.19 / s = 0.19 / 0.57 = 0.33
Resistance to pesticides in houseflies Fig. 8.24 Z&E
Weeds quickly evolve resistance to herbicides Fig. 8.25 Z&E
DRUG RESISTANCE Source: Annex B of “The Race Against Drug Resistance”