Download

1 / 125
1.76k likes | 2.7k Vues
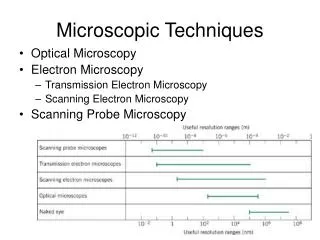
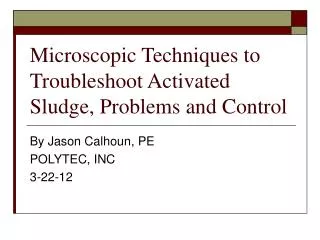
Microscopic Techniques to Troubleshoot Activated Sludge, Problems and Control. By Jason Calhoun, PE POLYTEC, INC 3-22-12. Microscopic Evaluations Equipment and techniques Interpreting Results Floc Size Shape Compaction/Density Open floc or bridging Filaments How to identify

E N D
Microscopic Techniques to Troubleshoot Activated Sludge, Problems and Control By Jason Calhoun, PE POLYTEC, INC 3-22-12
Microscopic Evaluations Equipment and techniques Interpreting Results Floc Size Shape Compaction/Density Open floc or bridging Filaments How to identify What to they tell us Filamentous Bulking Higher life forms Identification What they tell us Toxicity (Nitrification) Bulk water What to look for Overall Health Putting all of the pieces together Topic we will Cover (Microscope Techniques)
What we will Cover(Microbiology Problems and Causes) • Microbiology Problems and Their Causes • Poor Floc Formation, Pin Floc and Dispersed Growth. • Toxicity • Nitrification and Denitrification Problems • Nutrient Deficiency and Polysaccharide Bulking and Foaming • Zoogloeal Bulking and Foaming • Filamentous Bulking • Filamentous Foaming
What we will Cover (Control Methods) • Short Term Control Methods • Sludge Juggling • Polymer Addition • Chlorination • Long Term Control Methods • Low Dissolved Oxygen Problems • Wastewater Septicity and Organic Acids • Low F/M Conditions and Selectors • Nutrient Deficiency • Foaming Control
Why Perform Microscopic Evaluations? • Proactive tool to monitor biological health within your activated sludge system. “The real “heart” of the activated sludge system is the development and maintenance of a mixed microbial culture that treats wastewater and which can be managed… Be a good bug farmer” Eikelboom • Predict toxic upset events. • Detect when operational changes need to be made!
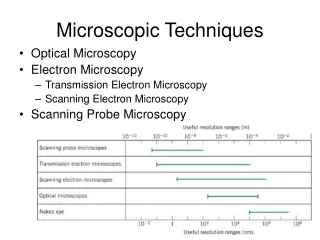
Research grade phase contrast microscope. Both 10x and 100x (oil emersion) phase contrast objectives that yield 100x and 1000x respectively. 25-mm X 75-mm microscope slide 22-mm X 22-mm (No. 1) glass cover slip Emersion oil Gram stain Neisser stain Equipment
Why Phase Contrast? • Phase contrast is needed because biological materials have very low contrast when viewed with direct illumination. • Phase contrast illumination reveals much more detail in low contrast materials.
Sampling • Take mixed liquor samples at points of good mixing. • Effluent end of an aeration basin • Mixed liquor channel between the aeration basin and the secondary clarifier. • Take MLSS samples below the surface. • Exclude any foam or other floating material. • When excessive foam exist collect a separate sample for examination.
Sampling Frequency • Dictated by circumstances • Daily during critical periods (bulking, RAS chlorination, changes or experimental operation). • Once every MCRT for routine characterization. • Weekly for process control.
Sample Preparation (Wet Mount) • Shake to completely mix sample. • Place 1 drop (approximately 0.05 mL) of sample using a clean, disposable Pasteur pipette in the middle of the slide. • Drop cover slip across the sample from left to right. • Place a clean paper towel across the entire cover slip and slowly apply pressure as you roll your hand across the sample while slightly increasing pressure from left to right.
Observation (100X using 10X objective) • Examine the wet mount under phase contrast illumination at 100X (using 10X objective) magnification for the following characteristics: • Floc Size • Floc Characteristics • Protozoa and Other Macroorganisms • Non-biological Organic and Inorganic Particles • Bacterial Colonies • Cell Dispersed in Bulk Solution • Effects of Filamentous organisms on floc structure • Filamentous Organism Abundance
Floc • Basic floc formation is required for activated sludge operation due to the use of gravity clarifiers. • Floc-forming species use the formation of extracellular polysaccharide, protein and cellulose fibrils to cement bacteria together to form floc. • Good floc formation occurs at lower growth rates and at lower nutrient levels, essentially starvation or stationary growth!
Floc.. What to Look for? • Shape • Round • Irregular • Compaction • Open? • Dispersed • Size • Small, Medium or Large • Pin Floc
Floc Characteristics • Round- Perfectly round • Irregular- Jagged edges not round. • Compact- Very compacted and not open or dispersed. • Diffused- Loose and not compact. • Open- Visible open holes in floc.
Understanding Floc Size • To determine the floc size in your sample, measure 10 to 20 flocs and place them in the following size categories based on their minimum dimensions or diameters if they are spherical. • Small < 150um • Medium 150 – 500 um • Large > 500 um
Ideal Floc • Round and compact settle the best and produce the best effluent quality. • Dispersed, open, and irregular prevent solids from settling. Produces higher TSS numbers and increases chemical cost.
Dispersed Floc Growth • Dispersed growth is caused by the absence or disruption of exopolymer bridging so that microorganisms do not stick to each other. • This typically occurs when you have nonflocculating bacteria at very high growth rates.
Dispersed and Non-Settable • Dispersed floc occurs when: • Growth rate is too fast. • High organic loading • High F:M ratio. • Settling does not occur and very turbid effluent exist
Correction Plan • Reduction in F/M of the system by raising the MLSS concentration. • Monitor or check for toxicity in the system.
Pin Floc • Small, weak flocs formed in activated sludge, consist of bacteria without a filament backbone and are usually < 50 um are named pin floc. Typically causes floating solids in the clarifier leading to turbid effluent. • Occurs: • Starvation or Low F/M • Long Sludge Age • Chronic Toxicity
Correction (Pin Floc) • Add organic substrate (Glycerin, Methanol) • Increase SRT and/or HRT • Increase wasting to balance F/M
Effects of Filamentous on Floc Structure • None • Bridging: Filaments extend from the floc surface into the bulk solution and bridge between the flocs. • Open Floc Structure: Floc population attaches and grows around the filamentous organisms leading to large, irregularly shaped flocs with substantial internal voids.
Protozoa and Other Macroorganisms • After looking at floc health, the next observation to be made is to scan the entire slide for Protozoa. • Look under 10x or 100x objective. • Identify types of protozoa. • Activity. • numbers
Higher Life-forms • In a wastewater treatment system, the next higher life form above bacteria are protozoans. These single-celled animals perform three significant roles in the activated sludge process. • floc formation • cropping of bacteria • removal of suspended material (BOD). • Protozoans are also indicators of biomass health and effluent quality. • The presence of protozoans and metazoans and the relative abundance of certain species can be a predictor of operational changes within a treatment plant. In this way, an operator is able to make adjustments and minimize negative operational effects simply by observing changes in the protozoan and metazoan population.
Higher Life forms as indicator Organisms • Various protozoan and invertebrate groups develop in activated sludge according to growth conditions. Thus, the activated sludge growth at (MCRT) rarely limits the development of these organisms. • Principally, food availability is the primary determination of which group predominates!
Types of Higher Life Forms • The six basic groups observed in activated sludge are: • Flagellates • Amoebae • Free Swimming Ciliates • Attached/Stalked Ciliates • Rotifers • Invertebrates
Small oval or elongated forms actively motile with whip like flagellae. Feed on soluble organic matter seen in high BOD systems. 1 Flagellates
Vary in shape in size and are motile via “false feet”. Grow well on particulate organic matter and tolerate low DO. 1 Amoebae
Round to oval in shape and are actively motile via row of short, hair-like cilia. Found under conditions of good floc formation and generally indicate good operation. Good indicator of toxicity 1 Free Swimming Ciliates
Similar appearance and found in same conditions as crawling ciliates but attached to stalks. Found in low organic loading or low MCRT Attached Ciliates
Variety of shapes and have more complex structures than protozoa. Most are motile and attach to activated sludge flocs with contractile “feet.” Occur in all and any conditions especially high MCRT 1 Rotifers
Include nematodes, tardigrades, gasterotrichs and annelids. Only observed at higher MCRTs. Tardigrades, gasterotrichs and annelids occur only in nitrifying system. 1 Higher Invertebrates
Healthy protozoa abundance • Mixture of the following in healthy system in equal numbers: • Free-swimming ciliates • Attached ciliates • Rotifers
Plant Start-up, low MCRT, or high organic loading • Flagellates • Amoebae • Small swimming ciliates
High MCRT and Low Organic Loading • Attached ciliates • Rotifers • Invertebrates such as nematodes
High F/M and/or Low MCRT • Flagellates • Amoebae • Free swimming ciliates • All appear in very high abundance
Low F/M High MCRT • Attached ciliates • Rotifers • High concentration of other higher life forms, especially nematodes
Toxicity Assessment and Higher Life-forms • Typically ciliates and rotifers are the first to be impacted. • First noticeable sign is slowing or cessation of cilia movement. • Second, flagellates become abundant organism along with small swimming ciliates. • Third (severe case) all protozoa die, lyses and release their cell contents, sometimes producing white foam.
Toxicity • Toxic shocks can cause severe problem in activated sludge operation. • Myths say this is more common in industrial wastewater than municipal, but are false!
Diagnosing Toxicity Microscopically • Look for initial flagellate bloom • Subsequent complete die-off of protozoa and other higher life forms • Biomass deflocculation, often accompanied by foaming • Loss of BOD removal • Filamentous bulking upon process recovery.
Observations (10x) • Floc health • Protozoa activity and abundance • Bulk water observation • Helps us understand flocculation • Identify broken or damaged filaments • Observe encapsulation or zoogloea.
Bulk Water Observation • Very subjective based on plant effluent. Some plants have a lot of organic particulate. Monitor the following: • Broken floating filaments • Zooglea • Dispersed Cells • Dead higher life forms • Pin floc • Encapsulated cells
Ideal Bulk Water • Clean and clear of debris which results in a quality supernatant. • Some industries pulp and paper or other industrial will always have pulp fiber and other debris in bulk water due to operation. • Always subjective and look for changes from exam to exam.