Download
1 / 13
130 likes | 244 Vues
Objective Evaluation of the Meso-NH Simulations during Hibiscus-Troccinox-Troccibras. Forecasts for the TROCCINOX campaign Three case studies: 13 Feb, 24 Feb, 3 March. J.-P Chaboureau, J.-P. Cammas, J. Duron, F. Gheusi, C. Mari, P. J. Mascart, J.-P. Pinty

E N D
Objective Evaluation of the Meso-NH Simulations during Hibiscus-Troccinox-Troccibras • Forecasts for the TROCCINOX campaign • Three case studies: 13 Feb, 24 Feb, 3 March J.-P Chaboureau, J.-P. Cammas, J. Duron, F. Gheusi, C. Mari, P. J. Mascart, J.-P. Pinty Laboratoire d’Aérologie (UPS/CNRS) Toulouse, France
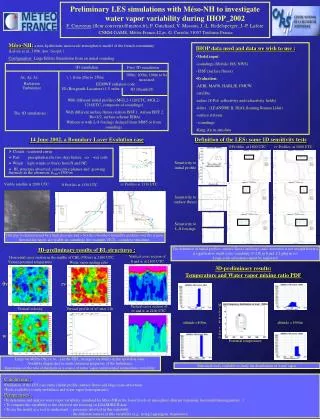
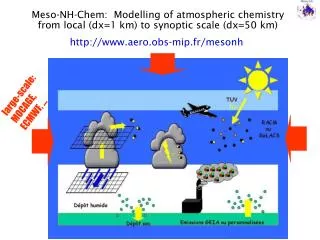
Daily real-time runs from 27 January to 5 March 2004 posted on http://www.aero.obs-mip.fr/mesonh/troccinox I. Forecasts for the Campaign • One single domain • horizontal grid: 100 x 100 points at 30 km resolution • 72 levels: from 40 m (bottom) up to 600 m (top) • Physics • turbulence: CBR TKE 1D scheme • convection: Bechtold’s scheme • microphysics: Pinty-Jabouille • surface: ISBA • radiation: ECMWF • Initialization/coupling with ECMWF forecasts • Lagrangian tracers • Simulated GOES-E brightness temperature (Tb) 3000 km 3000 km
Model-to-satellite Approach Meso-NH CTRL without cloud fraction GOES-E 11 m Tb +24 h 11 m Tb Cloud top height Direct comparison Meso-NH SUBG with cloud fraction=f(Q1) 00 UTC 24 Feb +24 h
30-day Objective Evaluation Full domain 3000x3000 km2 IR Tb Correlation 13-14 Feb Falcon+SF2 24 Feb SF4 3-4 March Falcon Bauru area 150x150 km2 IR Tb
Diurnal Cycle over Bauru Area Surface Flux IR Tb CAPE/CIN Precipitation 30-day average Bauru area 150x150 km2
Time Evolution over Bauru CAPE IR Tb min(TB)<205 K Min(TB)<205 K Precipitation Bauru area 150x150 km2
Time-Longitude Diagram Precipitation Meso-NH Tb GOES-E Tb % of Tb<205K Data averaged within 75 km around Bauru
II. Three Case Studies • Preliminary work for three cases: • - 13-14 Feb, 24-25 Feb, and 3-4 March • Same setup as for the forecasts (x=30 km), but: • coupling with analyses (instead of ECMWF forecast) • use of the subgrid cloud scheme • Comparisons with: • - Meteosat Second Generation observations • Falcon and SF2/4 measurements
Comparison with MSG at 10.8 m Meteosat-8 00 UTC 14 Feb 00 UTC 25 Feb 00 UTC 4 March Meso-NH
Comparison with MSG at 3.9 m Meteosat-8 00 UTC 14 Feb 00 UTC 25 Feb 00 UTC 4 March Meso-NH
Comparison with Falcon Flights 1650-2015 UTC 14 Feb 48 h Meso-NH run 36 h Meso-NH runFalcon flight 1719-2055 UTC 3 March Data from DLR
Comparison with SF2 and SF4 24-25 Feb. 13-14 Feb. Data from G. Durry (CNRS)
Conclusions • Forecasts for the TROCCINOX campaign • better agreement with satellite observation when using the subgrid cloud scheme • diurnal cycle of precip. in advance by 3 hours • Deep convection events with Tb<205K more frequent during cold front episodes • Three case studies • encouraging results when comparing with satellite and in-situ observations