Z-Scores: Standardized Assessment Scores and Normal Distributions
330 likes | 414 Vues
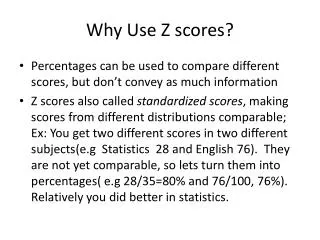
Learn how z-scores standardize assessment data for comparison, calculate z-scores, interpret normal distributions, and use percentile rankings.

Z-Scores: Standardized Assessment Scores and Normal Distributions
E N D
Presentation Transcript
z-Scores Standardized Scores
Standardizing scores • With non-equivalent assessments it is not possible to develop additive summary statistics. • e.g., averaging the scores from assessments with different maximum scores. • In classrooms we solve this problem by assigning grades which represent a uniform evaluation for every assessment. • i.e., A, B, C, D, F
Standardizing scores • Grades often have a subjective interpretation which makes comparing students using average grades problematic. • Assuming that assessments themselves are minimally subjective (i.e., well-designed) some consistent measure of student achievement can be used across assessments.
Histogram • A bar chart of a frequency distribution. 0 — 2 1 — 3 2 — 0 3 — 2 4 — 4 5 — 3 6 — 3 7 — 5 8 — 3 9 — 2 10—2
Summary Statistics • The summary statistics used to describe interval data are mean and standard deviation. • Standard deviation represents the average distance of observed scores from the mean. • Any given score can be represented as the number of standard deviations from the mean.
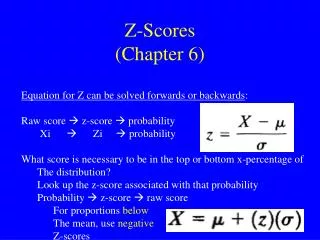
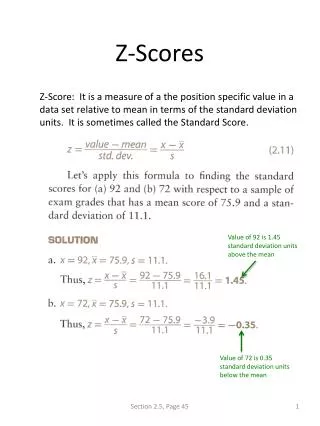
z-Scores • Hence: A z-score is the distance a given score is from the mean divided by the standard deviation. (score – mean)/standard deviation = z • A z-score is a given score translated into units of standard deviation. Common standard score for any interval assessment
z-Score Computation • Subtract the mean of the distribution from the target score. • Divide by the standard deviation. • Positive z-scores are above the mean. • Negative z-scores are below the mean.
Histogram • A bar chart of a frequency distribution. 0 — 2 1 — 3 2 — 0 3 — 2 4 — 4 5 — 3 6 — 3 7 — 5 8 — 3 9 — 2 10—2 sd = 2.61 Mean = 5.74
z-Score Computation • For a score of 9: z = (9-5.74)/2.61 = 1.25 sd above the mean • For a score of 4: z = (4-5.74)/2.61 = - 0.67 sdbelow the mean • Positive z-scores are above the mean. • Negative z-scores are below the mean.
What is Molly’s z-score on the test? What is Karl’s • 34 • 56 • 22 • 31 • 44 • 47 • 37 • 42 • 51 • 37 • 40 • 29 • 36 • 39 • 52 • 39 • 29 • 51 • 45 • 47 • 42 Karl Molly
Normal curve Characteristic curve Bell curve Normal distribution Gaussian distribution Continuous probability distribution This is a simplified histogram–a line connecting the tops of the bars of a histogram.
Normal Distributions • Artificial construction—do not occur in nature • A lot of things seem like they are normally distributed but they are only close • Standardized tests are constructed to be normally distributed
Properties of Normal Distributions In a normal distribution the mean, median and mode appear at the same point. Normal distributions are symmetrical.
Normal Curves 1 Standard Deviation Mean
Normal Curves 1 Standard Deviation Mean 50.0
Normal Curves 1 Standard Deviation Mean 50.0 34.13
Normal Curves 2 Standard Deviations Mean 50.0 34.13 13.59
Normal Curves 0.13% 0.13% 2.14% 2.14% 13.59% 13.59% 34.13% 34.13% Standard Deviations -3 -1 0 +2 +3 -2 +1 The Empirical Rule
A test score Cognitive abilities are generally normally distributed. Then, if the tests are designed carefully the assessment of cognitive ability should be normally distributed as well. Results from a standardized test are, by definition, normal distributed.
A test score z Scores Mean SD -3 -2 -1 1 2 3 If you know the percentage of scores that are lower than the target score you will know the Percentile Rank of the target score.
Normal Curves 2 Standard Deviations Mean 50.0 34.13 13.59 1. The relationship between SD and percentage of the area under the curve is constant regardless of the distribution. 2. If the mean and SD of the distribution are known then the percentage of scores lower than every possible score can be computed. 3. In other words, percentile rank of every score can be computed.
Target Score(28) Subtract the mean of the distribution from the target score. Divide by the standard deviation. Look up the z score on the z table. Mean(25.69) 1 SD(2.72) SD -3 -2 -1 1 2 3 Number of SD away from the mean Percentage of scores lower than the target score
z Score • Target score (28) • Score - Mean (28 - 25.69 = 2.31) • Result / SD (2.31 / 2.72 = .85) • Look up on z table (0.85) • z = 0.85; area = .8023 • Score is in the 80th percentile
28 z Scores 25.69 SD -3 -2 -1 1 2 3 .85 SD 80 % of scores
Target Score z Scores Mean SD -3 -2 -1 1 2 3
z Scores 23 25.69 SD -3 -2 -1 1 2 3 -.99 SD 16 % of scores
z Score • Target score (23) • Score - Mean (23 - 25.69 = -2.69) • Result / SD (-2.69 / 2.72 = -.99) • Look up on z table (-.99) • z = -0.99; area = .1611 • Score is in the 16th percentile
z Scores 23 25.69 SD -3 -2 -1 1 2 3 -.99 SD 16 % of scores
Percentile Rankings • z Scores • Assume a normal distribution • Based on knowing everyone in the population • Allows comparison of individualto the whole
Practice • Open the Excel file from the course webpage: OWM Data • What is the percentile rank of a score of 10 on the variable pre? • What is the percentile rank of a score of 10 on the variable delayed?
Normal Curves 0.13% 0.13% 2.14% 2.14% 13.59% 13.59% 34.13% 34.13% Standard Deviations (z-scores) -3 -2 -1 0 +1 +2 +3 0.01% 2.3% 15.9% 50.0% 84.1% 97.7% 99.9% Cumulative Percentages Percentile Equivalents 1 5 10 20 40 60 80 90 95 99 30 50 70 Standford-Benet IQ Scores 55 70 85 100 130 145 115 SAT Scores (sd 209) 400 608 817 1026 1235 1444 1600
Bobby and Sally take a standardized test that has 160 questions • Bobby gets a raw score of 140 and has a percentile rank of 52. Sally gets a raw score of 142 and has a percentile rank of 67. • This doesn’t make sense to Bobby’s mother. First, how can 140 out of 160 be 52nd percentile. And second, why should just a couple of points on the test make such a huge percentile rank difference? What are you going to tell her? • Explain this to Bobby’s mother in a paragraph or two and send me what you have written. • For a challenge (if you have time), what is the mean and standard deviation for this test? (solution)