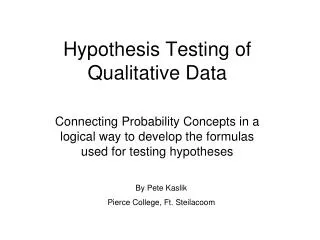
Analyze Phase Hypothesis Testing Non Normal Data Part 2
370 likes | 384 Vues
Analyze Phase Hypothesis Testing Non Normal Data Part 2. Hypothesis Testing Non Normal Data Part 2. Welcome to Analyze. “ X ” Sifting. Inferential Statistics. Intro to Hypothesis Testing. Hypothesis Testing ND P1. Hypothesis Testing ND P2. Hypothesis Testing NND P1. Tests for Proportions.

Analyze Phase Hypothesis Testing Non Normal Data Part 2
E N D
Presentation Transcript
Hypothesis Testing Non Normal Data Part 2 Welcome to Analyze “X” Sifting Inferential Statistics Intro to Hypothesis Testing Hypothesis Testing ND P1 Hypothesis Testing ND P2 Hypothesis Testing NND P1 Tests for Proportions Hypothesis Testing NND P2 Contingency Tables Wrap Up & Action Items
Attribute Data Attribute Data One Factor Two Factors Two or More Samples One Sample Two Samples One Sample Proportion Two Sample Proportion Chi Square Test (Contingency Table) MINITABTM: Stat - Basic Stats - 2 Proportions If P-value < 0.05 the proportions are different MINITABTM: Stat - Tables - Chi-Square Test If P-value < 0.05 at least one proportion is different Chi Square Test (Contingency Table) MINITABTM: Stat - Tables - Chi-Square Test If P-value < 0.05 the factors are not independent Hypothesis Testing Roadmap Attribute Data
For Continuous Data: Capability Analysis – a minimum of 30 samples Hypothesis Testing – depends on the practical difference to be detected and the inherent variation in the process as well as the statistical confidence you wish to have. For Attribute Data: Capability Analysis – a lot of samples Hypothesis Testing – a lot but depends on practical difference to be detected as well as the statistical confidence you wish to have. Sample Size and Types of Data MINITABTM can estimate sample sizes but remember the smaller the difference that needs to be detected the larger the sample size must be!
Proportion versus a Target • This test is used to determine if the process proportion (p) equals some desired value, p0. • The hypotheses: • Ho: p = p 0 • Ha: p p 0 • The observed test statistic is calculated as follows:(normal approximation) • This is compared to Zcrit = Za/2
Proportion versus a Target • Shipping accuracy has a target of 99%; determine if the current process is on target. • Hypotheses: • Ho: p = 0.99 • Ha: p 0.99 • One sample proportion test • Choose a = 5% • Sample size: Stat > Power and Sample Size > 1 Proportion… Enter multiple values for alternative values of p and MINITABTM will give the different sample sizes.
Proportion versus a Target Power and Sample Size Test for One Proportion Testing proportion = 0.99 (versus not = 0.99) Alpha = 0.05 Alternative Sample Target Proportion Size Power Actual Power 0.95 140 0.9 0.900247 0.96 221 0.9 0.900389 0.97 428 0.9 0.900316 0.98 1402 0.9 0.900026 • Our sample included 500 shipped items of which 480 were accurate.
Proportion versus a Target Stat > Basic Statistics > 1 Proportion… Test and CI for One Proportion Test of p = 0.99 vs p not = 0.99 Exact Sample X N Sample p 95% CI P-value 1 480 500 0.960000 (0.938897, 0.975399) 0.000 • Statistical Conclusion: Reject the null hypothesis because the hypothesized Mean is not within the confidence interval. • Practical Conclusion: We are not performing to the accuracy target of 99%.
Exercise • Exercise objective: To practice solving problem presented using the appropriate Hypothesis Test. • You are the shipping manager charged with improving shipping accuracy. Your annual bonus depends on your ability to prove shipping accuracy is better than the target of 80%. • How many samples do you need to take if the anticipated sample proportion is 82%? • Out of 2000 shipments only 1680 were accurate. • Do you get your annual bonus? • Was the sample size good enough?
Proportion vs Target Example: Solution First we must determine the proper sample size to achieve our target of 80%. Stat > Power and Sample Size > 1 Proportion…
Proportion versus Target Example: Solution • Now let’s calculate if we receive our bonus… • Out of the 2000 shipments 1680 were accurate. Was the sample size sufficient? ?
Comparing Two Proportions • This test is used to determine if the process defect rate (or proportion, p) of one sample differs by a certain amount, D, from that of another sample (e.g., before and after your improvement actions) • The hypotheses: H0: p1 - p2 = D Ha: p1 – p2 = D • The test statistic is calculated as follows: • This is compared to Zcritical = Za/2 Catch some Z’s!
Take a few moments to practice calculating the minimum sample size required to detect a difference between two proportions using a power of 0.90. Enter the expected proportion for proportion 2 (null hypothesis). For a more conservative estimate when the null hypothesis is close to 100 use smaller proportion for p1. When the null hypothesis is close to 0, use the larger proportion for p1. ap1 p2 n 5%.010.790.8___________ 5%.010.810.8 ___________ 5%.020.080.1 ___________ 5%.020.120.1___________ 5%.010.470.5___________ 5%.010.530.5___________ Sample Size and Two Proportions
Proportion versus a Target • Shipping accuracy must improve from a historical baseline of 85% towards a target of 95%. Determine if the process improvements made have increased the accuracy. • Hypotheses: • Ho: p1 – p2= 0.0 • Ha: p1 – p2 0.0 • Two sample proportion test • Choose a = 5% • Sample size ~ Stat>Power and Sample Size> 2 Proportions… Power and Sample Size Test for Two Proportions Testing proportion 1 = proportion 2 (versus not =) Calculating power for proportion 2 = 0.95 Alpha = 0.05 Sample Target Proportion 1 Size Power Actual Power 0.85 188 0.9 0.901 451 The sample size is for each group.
The following data were taken: Calculate proportions: Comparing Two Proportions Before Improvement: 600 samples, 510 accurate After Improvement: 225 samples, 212 accurate
Comparing Two Proportions Stat>Basic Statistics>2 Proportions… • Statistical Conclusion: Reject the null • Practical Conclusion: You have achieved a significant difference in accuracy. Test and CI for Two Proportions Sample X N Sample p 1 510 600 0.850000 2 212 225 0.942222 Difference = p (1) - p (2) Estimate for difference: -0.0922222 95% CI for difference: (-0.134005, -0.0504399) Test for difference = 0 (vs not = 0): Z = -4.33 P-Value = 0.000
Exercise • Exercise objective: To practice solving a problem presented using the appropriate Hypothesis Test. • Boris and Igor tend to make a lot of mistakes writing requisitions. • Who is worse? • Is the sample size large enough?
2 Proportion vs Target Example: Solution • First we need to calculate our estimated p1 and p2 for Boris and Igor. Boris Igor
2 Proportion vs Target Example: Solution Now let’s see what the minimum sample size should be… Stat > Power and Sample Size > 2 Proportions
Contingency Tables • Contingency Tables are used to simultaneously compare more than two sample proportions with each other. • It is called a Contingency Table because we are testing if the proportion is contingent upon, or dependent upon, the factor used to subgroup the data. • This test generally works the best with five or more observations in each cell. Observations can be pooled by combining cells. • Some examples for use include: • Return proportion by product line • Claim proportion by customer • Defect proportion by manufacturing line That? ..oh, that’s my contingency table!
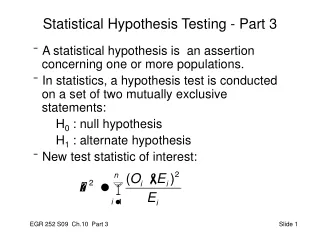
The null hypothesis is that the population proportions of each group are the same. Ho: p1 = p2 = p3 = … = pn Ha: at least one p is different Statisticians have shown the following statistic forms a chi-square distribution when H0 is true: Where “observed” is the sample frequency, “expected” is the calculated frequency based on the null hypothesis and the summation is over all cells in the table. Contingency Tables
Test Statistic Calculations Chi-square Test • Where: • O = the observed value (from sample data) • E = the expected value • r = number of rows • c = number of columns • Frow = total frequency for that row • Fcol = total frequency for that column • Ftotal = total frequency for the table • n = degrees of freedom [(r-1)(c-1)] From the Chi-Square Table
Contingency Table Example • Larry, Curley and Moe are order entry operators and you suspect one of them has a lower defect rate than the others. • Ho: pMoe = pLarry = pCurley • Ha: at least one p is different • Use Contingency Table since there are 3 proportions. • Sample Size: To ensure a minimum of 5 occurrences were detected the test was run for one day. Can’t you clowns get the entries correct?!
Contingency Table Example • The sample data are the “observed” frequencies. To calculate the “expected” frequencies, first add the rows and columns: • Then calculate the overall proportion for each row: 33/108 = 0.306
Contingency Table Example Now use these proportions to calculate the expected frequencies in each cell: 0.306 * 45 = 13.8 0.694 * 38 = 26.4
Contingency Table Example • Next calculate the 2 value for each cell in the table: • Finally add these numbers to get the observed chi-square: MoeLarryCurley Defective0.9121.1232.841 OK0.4010.4941.250
Contingency Table Example • A summary of the table: Defective OK
Contingency Table Example • Critical Value ~ • Like any other Hypothesis Test compare the observed statistic with the critical statistic. We decide a = 0.05 so what else do we need to know? • For a chi-square distribution we need to specify n in a Contingency Table: • n = (r - 1)(c - 1), where • r = # of rows • c = # of columns • In our example we have 2 rows and 3 columns so n = 2 • What is the critical chi-square? For a Contingency Table all the risk is in the right hand tail (i.e. a one-tail test); look it up in MINITABTM using Calc>Probability Distributions>Chisquare…
Contingency Table Example • Graphical Summary: • Since the observed chi-square exceeds the critical chi-square we reject the null hypothesis that the defect rate is independent of which person enters the orders. Chi-square probability density function for n = 2 Accept Reject
Contingency Table Example • Using MINITABTM ~ • Of course MINITABTM eliminates the tedium of crunching these numbers. Type the order entry data from the Contingency Table Example into MINITABTM as shown: • Notice the row labels are not necessary and row and column totals are not used just the observed counts for each cell.
Contingency Table Example Stat>Tables>Chi-Square Test (2 way table in worksheet) Chi-Square Test: Moe, Larry, Curley Expected counts are printed below observed counts Chi-Square contributions are printed below expected counts Moe Larry Curley Total 1 5 8 20 33 7.64 11.61 13.75 0.912 1.123 2.841 2 20 30 25 75 17.36 26.39 31.25 0.401 0.494 1.250 Total 25 38 45 108 Chi-Sq = 7.021, DF = 2, P-Value = 0.030 • Statistical Conclusion: Reject the null hypothesis. • Practical Conclusion: The defect rate for one of these stooges is different. In other words, defect rate is contingent upon the stooge.
Exercise • Exercise objective: To practice solving problem presented using the appropriate Hypothesis Test. • You are the quotations manager and your team thinks the reason you do not get a contract depends on its complexity. • You determine a way to measure complexity and classify lost contracts as follows: • Write the null and alternative hypothesis. • Does complexity have an effect?
Contingency Table Example: Solution • First we need to create a table in MINITABTM • Secondly, in MINITABTM perform a Chi-Square Test Stat>Tables>Chi-Square Test
Contingency Table Example: Solution Are the factors independent of each other?
Overview Contingency Tables are another form of Hypothesis Testing. They are used to test for association (or dependency) between two classifications. The null hypothesis is that the classifications are independent. A Chi-square Test is used for frequency (count) type data. If the data is converted to a rate (over time) then a continuous type test would be possible. However, determining the period of time that the rate is based on can be controversial. We do not want to just pick a convenient interval; there needs to be some rationale behind the decision. Many times we see rates based on a day because that is the easiest way to collect data. However a more appropriate way would be to look at the rate distribution per hour. Per hour? Per day? Per month?
At this point you should be able to: Calculate and explain test for proportions Calculate and explain Contingency Tests Explain and execute a Chi-squared Test Summary
IASSC Certified Lean Six Sigma Green Belt (ICGB) The International Association for Six Sigma Certification (IASSC) is a Professional Association dedicated to growing and enhancing the standards within the Lean Six Sigma Community. IASSC is the only independent third-party certification body within the Lean Six Sigma Industry that does not provide training, mentoring and coaching or consulting services. IASSC exclusively facilitates and delivers centralized universal Lean Six Sigma Certification Standards testing and organizational Accreditations. The IASSC Certified Lean Six Sigma Green Belt (ICGB) is an internationally recognized professional who is well versed in the Lean Six Sigma Methodology who both leads or supports improvement projects. The Certified Green Belt Exam, is a 3 hour 100 question proctored exam. Learn about IASSC Certifications and Exam options at… http://www.iassc.org/six-sigma-certification/