Lecture 14 Non-parametric hypothesis testing
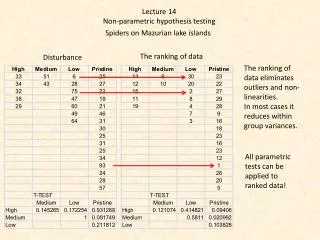
Lecture 14 Non-parametric hypothesis testing. Spiders on Mazurian lake islands. The ranking of data. Disturbance. The ranking of data eliminates outliers and non-linearities . In most cases it reduces within group variances . All parametric tests can be applied to ranked data!.

Lecture 14 Non-parametric hypothesis testing
E N D
Presentation Transcript
Lecture14 Non-parametrichypothesistesting Spiders on Mazurianlakeislands The ranking of data Disturbance The ranking of data eliminatesoutliers and non-linearities. In most casesitreduceswithin group variances. All parametrictestscan be applied to ranked data!
Effects of ranking Ranking oftenreducesthewithin group variances.
Pairedcomparisons of themean; Wilcoxon’smatchedpairsrank test TheWicoson test isthenon-parametricalternative to theone-wayrepeatedmeasures ANOVA W z isapproximatelynormallydistributed. Past uses a differentalgorithm for the same test.
Therank test of Withney and Mann – U-test Spiderabundances Expectedmeanif no difference Expected SE if no difference The U-test isthenonparametricalternative to thet-test.
Ranked data Raw data As in the case of the t-test does the ranked ANOVA result in lower significance levels. Ranking levels off the within group heterogeneity (lower within group variance). The test is less conservative.
Kruskal-Wallis test or Kruskal-Wallis one wayANOVA by ranks Raw data ANOVA KW is approximately χ2 distributed. Values can be taken from a c2 table with r-1 degrees of freedom
Random skewers Diversity of groundbeetlesalong an elevational gradient We take 1000 random samples and calculateeach time Spearman’srank order correlation.
Ifthereis no trend inspeciesrichness we expect a Bernoulli distribution of positive and negativecorrelations. Of 1000 rankcorrelations 623 werepositive. The associated probabilityis It’shighlyprobablethatthereis a altitudinal trend inspeciesrichness.
Home work and literature • Refresh: • U-test • Wilcoxonmatchedpairs test • Sign test • Kruskal Wallis test • Raw and ranked data • Tiedranks Literature: Łomnicki: Statystyka dla biologów http://statsoft.com/textbook/