Download

1 / 25
250 likes | 284 Vues
Learn about the evolution of the KFPA data analysis pipeline, existing software tools, missing components, prototype goals, and development priorities. Enhance your understanding of this crucial pipeline infrastructure.

E N D
Bob Garwood- NRAO-CV KFPA Data Pipeline
History • Science and Data Pipeline Workshop – November 2007. Initial pipeline sketch. • Conceptual Design Review – February 2008. Initial design. • KFPA Data Analysis Meeting – June 2008. • Memo describing possible KFPA observing modes. Pisano, August 2008.
Changes since Conceptual Design Review • Basic design essentially unchanged • Out-of-scope items (deferred) • continuum • cross-correlation (polarization) • complicated calibration schemes (“basketweaving”) • baseline fitting added as an explicit step
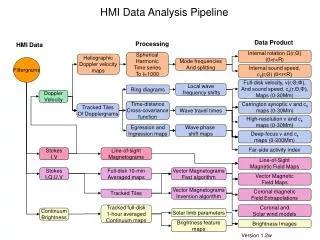
Existing GBT Data Analysis Software • sdfits tool produces SDFITS file – associates raw data from a backend with meta data describing the observations. DCR, SP, Spectrometer. (data capture) • GBTIDL – recommended spectral line analysis tool. Focused on single spectra processing and analysis, not on imaging. Used to prepare the data to be imaged elsewhere. (calibration, editing) • AIPS is used to produce images.
We can reduce k-band data now • K-band spectrometer data calibrated and imaged using existing tools.
Missing components • None of the steps to an image are automated. • Uses lab-measured Tcal values. • Uses a scalar Tcal without regard to any structure in Tcal across the bandpass. • Cross-correlation (polarization) data is not supported after the sdfits step. • Poor support for continuum data.
Missing Components continued • Only have prototype tool for visually interacting with large amounts of data (e.g. visual flagging). • Only prototype tools for statistically flagging or editing the data (e.g. RFI rejection).
Goals of the Prototype Pipeline • Support KFPA commissioning • Explore new processing tools/techniques not yet widely available in GB (vector calibration, statistical data flagging and editing, visualization, parallel processing). • Prototype an automated pipeline – add necessary meta data to capture user intent • Prototype tools necessary to support larger focal plane array (e.g. parallel computing)
Goals continued • Based on prototyped tools, estimate cost associated with delivering a pipeline and necessary computing hardware to handle the expected data rates for a larger focal plane array. • Develop these tools and pipeline infrastructure for use with data from other backends.
Pipelines • Crude pipeline can be assembled from existing components for quick-look images. • Small modification to sdfits (data capture) to properly capture individual feed offsets from pointing position. • Some additional meta data to capture default image parameters and associated “off” information.
Pipelines • Imperative for large focal plane array. • large data rates and volume • Necessary for even a modest 7 element array. • Useful for data from other GBT backends • Users often end up creating partial pipelines • The NRAO archive needs this to be able to provide more than just the raw GBT data. • Other telescopes routinely provide roughly-calibrated data to their users – most institutions consider this the starting point of a data pipeline.
Pipelines • Requires using a standard observing mode. • Sufficient meta data needs to be captured to drive the pipeline (e.g. groups of scans that should be processed together, associated “off” information, etc). • Individual components can be used outside of the pipeline – often with additional options.
Pipeline • None of those steps is unique to the KFPA • KFPA-specific steps are likely as part of the statistical flagging and editing component as well as in data capture. • Components are being developed independently. • no dependencies between components • Some components are likely to be useful interactively – especially flagging and editing.
Pipeline Design continued • Eventually - Continuum data will be extract from the spectral line data at the appropriate point in the pipeline. This work is out-of-scope for the initial pipeline. • Language – python • Experience with python in Green Bank • Same language used in the ALMA pipeline and in casa.
Pipeline design, continued • Data formats • SDFITS up to imaging step. • Currently produced by data capture (sdfits) • Tools already exist to interact with this data. • May be necessary to split data into multiple SDFITS files for parallel computing needs. • Alternatives used as necessary – for speed or take advantage of existing tools – e.g. AIPS
Parallel Computing • Most of these steps are “embarrassingly parallel” - data from individual feeds can be processed independently • exceptions: some statistical flagging and editing and cross-correlation data – these are out of scope for the initial pipeline. • Parallel processing will be explored during KFPA pipeline development.
Development Priorities • Calibration • Complete GBTIDL vector Tcal and initial calibration database work. • Design pipeline calibration database. • Data Capture • This is the current bottleneck. Work is underway to improve the processing speed. A new raw data format may be necessary.
Priorities continued • Data capture (continued) • ensure that feed offsets are used properly with pointing direction to get individual feed pointings • put default calibration values into calibration database (GBTIDL model first, pipeline model when design completed). • Add appropriate meta information as necessary to automate data flow through the pipeline.
Priorities, continued • Pipeline design and implementation • Automate flow of data between existing compontents. • Initially this will be a simple script triggered off of the standard observing modes using default values and available meta information. • It will be possible to re-run the pipeline using alternative parameters (e.g. baseline fits, additional statistical flags, interactive flagging and editing, etc).
Priorities, continued • Data Visualization • Evaluate existing tools for viewing with and interacting with GBT data in sdfits form. • Data quality throughout the pipeline • Interactive flagging • Summer student project – 2008 – prototype data viewer. Can do interactive flagging, not sufficiently general.
Priorities, continued • Investigate simple parallel processing options • start with existing code (sdfits) • take advantage of independence of data from each feed • keep things simple
Priorities, continued • Statistical data flagging • Borrow from code developed by GBTIDL users • Borrow from aips++/casa autoflagger • Develop “basketweaving” equivalent for KFPA array. • Use (near) crossing points on sky (same feed; multiple feeds) to adjust data. • out of scope for initial pipeline development
Priorities, continued • Algorithm development (calibration, continuum data handling, etc). Roberto Ricci, U. Calgary.
Resources • Bob Garwood, NRAO – 1 FTE, component design and development • Robert Ricci, U. Calgary – algorithm development