Semi-Supervised Learning Using Randomized Mincuts
This paper discusses the use of randomized mincuts for semi-supervised learning, where there is limited labeled data but plenty of unlabeled data. The approach utilizes the relationships between unlabeled examples to guide predictions and provides estimates of prediction confidence.

Semi-Supervised Learning Using Randomized Mincuts
E N D
Presentation Transcript
Semi-Supervised Learning Using Randomized Mincuts Avrim Blum, John Lafferty, Raja Reddy, Mugizi Rwebangira Carnegie Mellon
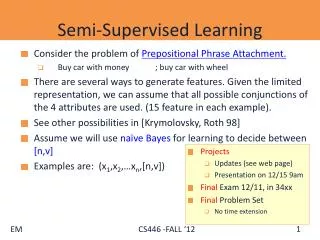
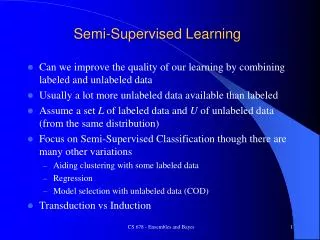
Motivation • Often have little labeled data but lots of unlabeled data. • We want to use the relationships between the unlabeled examples to guide our predictions. • Assumption: “Similar examples should generally be labeled similarly."
+ - Add auxiliary “super-nodes”
Obtain s-t mincut + - Mincut
Classification + - Mincut
Problem • Plain mincut gives no indication of it’s confidence on different examples. Solution • Add random weights to the edges. • Run plain mincut and obtain a classification. • Repeat the above process several times. • For each unlabeled example take a majority vote. • Margin of the vote gives a measure of the confidence.
Before adding random weights + - Mincut
After adding random weights + - Mincut
PAC-Bayes • PAC-Bayes bounds show that the ‘average’ of several hypotheses that are all consistent with the training data will probably be more accurate than any single hypothesis. • In our case each distinct cut corresponds to a different hypothesis. • Hence the average of these cuts will probably be more accurate than any single cut.
Markov Random Fields • Ideally we would like to assign a weight to each cut in the graph (a higher weight to small cuts) and then take a weighted vote over all the cuts in the graph. • This corresponds to a Markov Random Field model. • We don’t know how to do this efficiently, but we can view randomized mincuts as an approximation.
Related Work –Gaussian Fields • Zhu, Gharamani and Lafferty (ICML 2003). • Each unlabeled example receives a label that is the average of its neighbors. • Equivalent to minimizing the squared difference of the labels.
How to construct the graph? • k-NN • Graph may not have small balanced cuts. • How to learn k? • Connect all points within distance δ • Can have disconnected components. • How to learn δ? • Minimum Spanning Tree • No parameters to learn. • Gives connected, sparse graph. • Seems to work well on most datasets.
Experiments • ONE vs. TWO: 1128 examples . • (8 X 8 array of integers, Euclidean distance). • ODD vs. EVEN: 4000 examples . • (16 X 16 array of integers, Euclidean distance). • PC vs. MAC: 1943 examples . • (20 newsgroup dataset, TFIDF distance) .
Conclusions • We can get useful estimates of the confidence of our predictions. • Often get better accuracy than plain mincut. • Minimum spanning tree gives good results across different datasets.
Future Work • Sample complexity lower bounds (i.e. how much unlabeled data do we need to see?). • More principled way of sampling cuts?