EEG Classification using Semi Supervised Learning
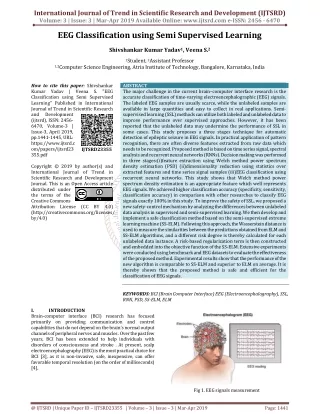
The major challenge in the current braincomputer interface research is the accurate classification of time varying electroencephalographic EEG signals. The labeled EEG samples are usually scarce, while the unlabeled samples are available in large quantities and easy to collect in real applications. Semi supervised learning SSL methods can utilize both labeled and unlabeled data to improve performance over supervised approaches. However, it has been reported that the unlabeled data may undermine the performance of SSL in some cases. This study proposes a three stages technique for automatic detection of epileptic seizure in EEG signals. In practical application of pattern recognition, there are often diverse features extracted from raw data which needs to be recognized. Proposed method is based on time series signal, spectral analysis and recurrent neural networks RNNs . Decision making was performed in three stages i feature extraction using Welch method power spectrum density estimation PSD ii dimensionality reduction using statistics over extracted features and time series signal samples iii EEG classification using recurrent neural networks. This study shows that Welch method power spectrum density estimation is an appropriate feature which well represents EEG signals. We achieved higher classification accuracy specificity, sensitivity, classification accuracy in comparison with other researches to classify EEG signals exactly 100 in this study. To improve the safety of SSL, we proposed a new safety control mechanism by analyzing the differences between unlabeled data analysis in supervised and semi supervised learning. We then develop and implement a safe classification method based on the semi supervised extreme learning machine SS ELM . Following this approach, the Wasserstein distance is used to measure the similarities between the predictions obtained from ELM and SS ELM algorithms, and a different risk degree is thereby calculated for each unlabeled data instance. A risk based regularization term is then constructed and embedded into the objective function of the SS ELM. Extensive experiments were conducted using benchmark and EEG datasets to evaluate the effectiveness of the proposed method. Experimental results show that the performance of the new algorithm is comparable to SS ELM and superior to ELM on average. It is thereby shown that the proposed method is safe and efficient for the classification of EEG signals. Shivshankar Kumar Yadav | Veena S. "EEG Classification using Semi Supervised Learning" Published in International Journal of Trend in Scientific Research and Development (ijtsrd), ISSN: 2456-6470, Volume-3 | Issue-3 , April 2019, URL: https://www.ijtsrd.com/papers/ijtsrd23355.pdf Paper URL: https://www.ijtsrd.com/engineering/electrical-engineering/23355/eeg-classification-using-semi-supervised-learning/shivshankar-kumar-yadav<br>

EEG Classification using Semi Supervised Learning
E N D
Presentation Transcript
International Journal of Trend in Scientific Research and Development (IJTSRD) Volume: 3 | Issue: 3 | Mar-Apr 2019 Available Online: www.ijtsrd.com e-ISSN: 2456 - 6470 EEG Classification using Semi Supervised Learning Shivshankar Kumar Yadav1, Veena S.2 1Student, 2Assistant Professor 1,2Computer Science Engineering, Atria Institute of Technology, Bangalore,Karnataka, India How to cite this paper: Shivshankar Kumar Yadav | Veena S. "EEG Classification using Semi Supervised Learning" Published in International Journal of Trend in Scientific Research and Development (ijtsrd), ISSN: 2456- 6470, Volume-3 | Issue-3, April 2019, pp.1441-1445, URL: https://www.ijtsrd.c om/papers/ijtsrd23 355.pdf Copyright © 2019 by author(s) and International Journal of Trend in Scientific Research and Development Journal. This is an Open Access article distributed under the terms of the Creative Commons Attribution License (CC BY 4.0) (http://creativecommons.org/licenses/ by/4.0) I. INTRODUCTION Brain-computer interface (BCI) research has focused primarily on providing communication and control capabilities that do not depend on the brain’s normal output channels of peripheral nerves and muscles . Over the past few years, BCI has been extended to help individuals with disorders of consciousness and stroke . At present, scalp electroencephalography (EEG) is the most practical choice for BCI [3], as it is non-invasive, safe, inexpensive, can offer favorable temporal resolution (on the order of milliseconds) [4], ABSTRACT The major challenge in the current brain–computer interface research is the accurate classification of time-varying electroencephalographic (EEG) signals. The labeled EEG samples are usually scarce, while the unlabeled samples are available in large quantities and easy to collect in real applications. Semi- supervised learning (SSL) methods can utilize both labeled and unlabeled data to improve performance over supervised approaches. However, it has been reported that the unlabeled data may undermine the performance of SSL in some cases. This study proposes a three stages technique for automatic detection of epileptic seizure in EEG signals. In practical application of pattern recognition, there are often diverse features extracted from raw data which needs to be recognized. Proposed method is based on time series signal, spectral analysis and recurrent neural networks (RNNs). Decision making was performed in three stages:(i)feature extraction using Welch method power spectrum density estimation (PSD) (ii)dimensionality reduction using statistics over extracted features and time series signal samples (iii)EEG classification using recurrent neural networks. This study shows that Welch method power spectrum density estimation is an appropriate feature which well represents EEG signals. We achieved higher classification accuracy (specificity, sensitivity, classification accuracy) in comparison with other researches to classify EEG signals exactly 100% in this study. To improve the safety of SSL, we proposed a new safety-control mechanism by analyzing the differences between unlabeled data analysis in supervised and semi-supervised learning. We then develop and implement a safe classification method based on the semi-supervised extreme learning machine (SS-ELM). Following this approach, the Wasserstein distance is used to measure the similarities between the predictions obtained from ELM and SS-ELM algorithms, and a different risk degree is thereby calculated for each unlabeled data instance. A risk-based regularization term is then constructed and embedded into the objective function of the SS-ELM. Extensive experiments were conducted using benchmark and EEG datasets to evaluate the effectiveness of the proposed method. Experimental results show that the performance of the new algorithm is comparable to SS-ELM and superior to ELM on average. It is thereby shown that the proposed method is safe and efficient for the classification of EEG signals. KEYWORDS: BCI (Brain Computer Interface) EEG (Electroencephalography), SSL, RNN, PSD, SS-ELM, ELM IJTSRD23355 Fig 1. EEG signals measurement @ IJTSRD | Unique Paper ID – IJTSRD23355 | Volume – 3 | Issue – 3 | Mar-Apr 2019 Page: 1441
International Journal of Trend in Scientific Research and Development (IJTSRD) @ www.ijtsrd.com eISSN: 2456-6470 and functions in most environments. As a crucial component embodied in general EEG-based BCIs, the classification problem of EEG signals is a key focus. Unfortunately, due to the high variability of EEG recordings, the real-time, accurate classification of EEG signals remains a challenging task. To effectively parse the various patterns of EEG signals, a number of different classification algorithms can be employed, including linear discriminant analysis (LDA), neural networks (NN), support vector machine (SVM), nonlinear Bayesian classifiers, nearest neighbor classifiers, and combinations thereof. Recently, a new method, known as the extreme learning machine (ELM), has been proposed by Huang et al. and demonstrated an improved learning speed and with better generalizability than well-known back propagation neural networks and SVMs. As a result, ELMs have been applied to pattern recognition tasks in images, speech, and EEG signals. Unfortunately, labeled EEG samples are scarce, expensive, and time-consuming to obtain (especially when labeling requires manual effort and expertise), while unlabeled EEG data are abundant, but not fully applicable to real clinical applications. Over the past few decades, semi-supervised learning has attracted significant attention and widely applied in speech recognition , object tracking , and face recognition . is the lowest level, which is a basic condition of UAV as long as it can fly. The coordination level provides the appropriate sequence of control and identification algorithm to the execution level, such as [9, 11]. The organization level is a highest level with environment awareness system, mission management etc., for example, [12, 13] introduces an autonomous cargo transportation system with high efficiency. This work presents a fully autonomous UAV research platform for indoor and outdoor search and rescue. II. BACKGROUND KNOWLEDGE In this section, we introduce two predecessors – ELM and SS- ELM in detail before introducing our risk based Safe-SSELM method, which uses a novel safety control mechanism that measures the risk degree by analyzing the behavior of unlabeled data in the ELM and SS-ELM algorithms. A.BASIC ELM Extreme learning machines are feed forward neural networks for classification, regression, clustering, sparse approximation, compression and feature learning with a single layer or multiple layers of hidden nodes, where the parameters of hidden nodes (not just the weights connecting inputs to hidden nodes) need not be tuned. These hidden nodes can be randomly assigned and never updated (i.e. they are random projection but with nonlinear transforms), or can be inherited from their ancestors without being changed. In most cases, the output weights of hidden nodes are usually learned in a single step, which essentially amounts to learning a linear model. B.SEMI-SUPERVISED ELM Semi-supervised learning can make full use of little labeled and numerous unlabeled samples to learn a classification model, which has important practical significance. Extreme Learning Machine(ELM) is a new supervised learning method and has better classification performance. Using semi- supervised learning to improve ELM and enable it to deal with both labeled and unlabeled samples, that is a very significant study. This paper proposed an algorithm called Semi-Supervised ELM based on Co-Training(SELM), improved the learning speed of co-training and extended ELM to semi-supervised learning. We train several ELM classifiers using a small number of labeled samples, using those high confidence unlabeled samples together with its mark to optimize the basic classifiers. Loop until meet the stop condition. The experiments show that the algorithm can effectively improve the processing speed and classification accuracy. III. MATERIAL AND METHODS In this study, EEG signals, publicly available data described in was used. The data were processed using Welch method power spectral density estimation and statistical features. Then we used recurrent and MLP neural networks as classifier on these processed data for classification EEG signals to normal and epileptic. A.Data description and selection We used the data described in the paper, which is publicly available. Regardless the different recording electrodes used for extra cranial and intracranial EEG registration, all other recording parameters were fixed. Some of the morphological characteristics of the different EEG time series under examination, which are obvious to an expert's eye, will be sketched in the following. EEG time series recorded extra cranially during the relax state of healthy subjects with eyes closed show a predominant physiological rhythm, the so- called alpha rhythm in a frequency range of 8-13 Hz, an activity which is most pronounced at the back of the head. In contrast, broader frequency characteristics are obtained for open eyes. EEG time series are also recorded intra cranially in humans, however only in the framework of a presurgical evaluation of focal epilepsies. In this context implantation of electrodes is carried out to exactly localize the seizure generating area which is termed the epileptogenic zone. During the seizure free interval the EEG recorded from within the epileptogenic zone is often characterized by intermittent occurrences of socalled interictal epileptiform activities. Investigation of these steep, sometimes rhythmic high amplitude patterns in EEG recordings contributes to localization of the epileptogenic zone. Finally, the EEG recorded during epileptic seizure, termed ictal activity, is almost periodic and of high amplitude, resulting from hyper synchronous activity of large assemblies of neurons. The complete data set consists of five sets (denoted A-E) each containing 100 EEG signals of 23.6 s period. After visual each inspection for artifacts, e.g., due to muscle activity or eye movements, we select the signals and cut out them from continuous multichannel EEG recordings. Sets A and B consisted of signals taken from surface EEG recordings that were carried out on five healthy volunteers using standardize electrode placement scheme. Volunteers were relaxed in an awake state with eyes open (A) and eyes closed (B), respectively. Sets C, D, and E originated from the EEG archive of presurgical diagnosis. The EEGs from five patients were selected, all of them had achieved complete seizure control after resection of one of the hippocampal formations, which was therefore correctly diagnosed to be the epileptogenic zone. Signals in set D were recorded from within the epileptogenic zone, and those in set C from the hippocampal formation of the opposite hemisphere of the brain. All EEG signals were recorded with the same 1 28-channel amplifier system, using an average common reference. After 12 bit analog-to-digital conversion, the data were written continuously onto the disk of data acquisition computer system at a sampling rate of 173.61 Hz. Band-pass filter setting were 0.53-40 Hz .In this paper we used two classes @ IJTSRD | Unique Paper ID - IJTSRD23355 | Volume – 3 | Issue – 3 | Mar-Apr 2019 Page: 1442
International Journal of Trend in Scientific Research and Development (IJTSRD) @ www.ijtsrd.com eISSN: 2456-6470 data sets, normal and epileptic (set A and E), for EEG signals classification. B.Spectral analysis using Welch method The Welch method is a power spectrum density estimator that applies the periodogram. It is based on Bartlett's idea of splitting of the data into segments and finding the average of their priodograms. Difference is that the segments are overlapped, where the overlaps are usually 50% or 75% large, and the data within the segment are windowed. By permitting overlap of sequences, we can form more segments than in the case of Bartlett's method. Also, if we keep the same number of segments, the overlap allows for longer segments. The increased number of the segments reduces the variance of the estimators, and the longer segments improve its resolution. Thus, with the Welch method we can trade reduction in variance for improvement in resolution in many more ways than with the Bartlett's method. It can be shown that if the overlap is 50%, the variance of the Welch estimator is approximately 9116 of the variance of the Bartlett estimator. C.Recurrent neural networks Multilayered architecture is a special architecture of neural models. With respect to the direction of their connection, multilayered networks are divided to feed forward and feedback networks. Highly nonlinear dynamic mappings can be performed by RNNs and therefore have temporally extended application, whereas multilayer feed forward networks are confined to performing static mappings. RNNs have many applications such as associative memory, spatiotemporal pattern classification, control, optimization and generalization of pattern sequences. IV. OUR METHOD In this section, we present our proposed safe semi-supervised extreme learning (Safe-SSELM) method, which designs an efficient safety-control mechanism to exploit unlabeled data. A.RISK DEGREE GENERATING ALGORITHM The degree of risk for unlabeled data is defined by analyzing their different behaviors in ELM and SS-ELM. When the SS- ELM prediction results for unlabeled samples are significantly different from those obtained by supervised ELM, the unlabeled sample may be assigned a large degree of risk and should be classified by ELM. Otherwise, the unlabeled sample may be considered safe and assigned a small risk degree, in which case samples should be classified by SS-ELM. Step (1): The supervised ELM and semi-supervised SS-ELM methods are used to separately predict the unlabeled samples. The ELM classifier is trained with {Xl, Yl} while the SS-ELM classifier is trained with {X, Y}, and both algorithms are subsequently used to obtain predictions of xj that belongs to the set of unlabeled samples, Xu, yielding the respective probability distribution vectors of y¯j and y˜j . The columns of the max values in y¯j and y˜j denote the predicted category labels, which are written as y¯j_label and y˜j_label respectively. Step (2): The Wasserstein distance is used to measure the similarity between the predictions made in Step (1) and the degrees of risk for unlabeled instances are calculated. The risk degree sj of unlabeled data xj is determined by a difference function df (xj). The Wasserstein distance is a general distance measure between any probability distributions. As a metric, it respects fundamental metric properties such as non-negativity, symmetry and the triangle inequality [28]. It has recently found some applications in multi-label classification. B.FORMULATION In the following, the risk degrees for unlabeled instances are quantified by the new ‘‘risky’’ item, which is then used to modify the objective function of the basic SS-ELM algorithm. By introducing a ‘‘risky’’ item, the new objective function of the proposed Safe-SSELM method is differentiated from that of the SS-ELM. The implementation of our Safe-SSELM method is described in Algorithm 1. It is important to highlight the key differences between the proposed Safe- SSELM method and its predecessors, including both ELM and SS-ELM. Firstly, considering the uncertainty of unlabeled data, we have designed a new safety-controlled strategy by introducing a measure of risk into the objective function of basic SS-ELM, which can lead to a safer exploitation of unlabeled data. Secondly, by building upon the traditional SS- ELM classifier, the new method inherits its advantages and is suitable for multi-classification. Algorithm 1 The Safe-SSELM Input: A training set {X, Y} = {{Xl, Yl}, Xu}, the parameters C, λ1, and λ2. Output: the output weights β ∗ between the hidden layer and output layer. 1: Perform supervised ELM classification and the semi- supervised SS-ELM classification; 2: Compute the risk degrees for unlabeled samples ; 3: Utilize the calculated risk degrees for unlabeled samples to construct the new ‘‘risky’’ item and obtain the new objective function; 4: Compute the output weights β ∗; 5: Return β ∗. V. In this study, we proposed a new scheme for detection . of epileptic seizure in EEG signals using power spectrum density (PSD) estimation and recurrent neural networks. This system. IS implemented using MA TLAB R2008a software package (With neural networks and signal processing toolboxes). In this research we choose two types (epileptic seizure and normal) of EEG signals that are publicly available for use in [4]. Selection of the NN inputs is the most important component in designing the NN for pattern classification since even the best classifier will perform poorly if the inputs are not selected well. Transforming of NN input data into a more appropriate representation can facilitate the learning process. Using a smaller number of parameter, which are often called features, to represent the signal under study is particularly important for recognition and diagnostic purpose p. First of all, we divided each class of EEG signals to 1600 segments which was formed into 256 discrete data using a rectangular window. The length of each EEG segment was 256 samples. In Fig.3, EEG signals belonging to two classes were shown. Then FFT based Welch method was applied to each EEG segment to obtain power spectral density (PSD) of each segment. After applying Welch method PSD the number PROPOSED SYSTEM @ IJTSRD | Unique Paper ID - IJTSRD23355 | Volume – 3 | Issue – 3 | Mar-Apr 2019 Page: 1443
International Journal of Trend in Scientific Research and Development (IJTSRD) @ www.ijtsrd.com eISSN: 2456-6470 of samples in each segment was reduced from 256 samples to 129 samples. High dimension feature vectors Increased computational complexity. To solve this problem, statistics over the time series EEG segments and power levels of PSD Fig.3: Examples of EEG signals of epileptic and normal subjects ?Classification accuracy: number of correct classified segments/ number of total segments. The classification performances (specificity, sensitivity, total classification accuracy) on the test datasets were presented in TABLE 1. In TABLE 2 the performance of the proposed method were compared with other algorithms. It shows obviously that the current work has higher accuracy than other methods. As can be seen from results, we conclude that Welch method PSD presents very strong features which well represent EEG signals and by usage of these features a good distinction between classes can be obtained. Also statistical features were used in dimensionality reduction of the extracted feature vectors representing the EEG signals (these statistical features were used as inputs of the classifier). The classification results indicate that RNN has considerable success in classification of EEG signals. TABLE I: The classification performances Fig.2: Architecture of Elman recurrent neural networks were used to reduce the dimension of the feature vectors. To do this the following statistical features were used: ?Maximum of each EEG time series segment and maximum of power levels of the Welch method. ?Minimum of each EEG time series segment and minimum of power levels of the Welch method. ?Mean of each EEG time series segment and mean of power levels of the Welch method. ?Standard deviation of each EEG time series segment and standard deviation of power levels of the Welch method. Using the above mentioned statistical features the dimension of each feature vector was reduced to 8 attributes. In this research we proposed recurrent neural networks (RNN) as a classifier for classification of two classes (epileptic seizure and healthy) of EEG signals. The RNN network was implemented with MA TLAB software with neural networks toolbox. 100 time series of 4096 samples for each class of EEG signals (epileptic seizure and normal) were divided into 1600 segments of 256 samples for each class. The training and test data sets of neural networks were formed by 3200 vectors (1600 vectors with 8 attributes for each class).We assigned 1600 vectors (800 vectors from each class) for training set and 1600 vectors (800 vectors from each class) for test set. In order to examine the performance of the RNN, for the same classification problem, the multilayer perceptron neural network (MLPNN) with the Back propagation learning algorithm was used. VI. EXPERIMENTAL RESULTS The performance of the classifier in this scheme was calculated by following measures. ?Specificity: number of correct classified healthy segments/ number of total healthy segments. ?Sensitivity: number of correct classified epileptic seizure segments/ number of total epileptic seizure segments. VII. The aim of this study was to find a new scheme for classification of EEG signals and detection of epileptic seizure with high accuracy using power levels of PSD and neural networks. This study demonstrates that Welch method power spectrum density estimation provides very strong features which well represent EEG signals. The high dimension of feature vectors increases computations. In order to solve this problem, statistical features were obtained from extracted feature vectors and time series EEG segment. The dimension of feature vectors was reduced to 8 attributes. Then for classification of these feature vectors, we used recurrent neural networks (RNN) as a classifier. For CONCLUSION @ IJTSRD | Unique Paper ID - IJTSRD23355 | Volume – 3 | Issue – 3 | Mar-Apr 2019 Page: 1444
International Journal of Trend in Scientific Research and Development (IJTSRD) @ www.ijtsrd.com eISSN: 2456-6470 [7]Y. Ma, X. Ding, Q. She, Z. Luo, T. Potter, and Y. Zhang, ‘‘Classification of motor imagery EEG signals with support vector machines and particle swarm optimization,’’ Comput. Math. Methods Med., vol. 2016, p. 4941235, May 2016. performance evaluation of proposed system, we computed sensitivity, specificity and classification accuracy (100%) using recurrent neural networks as a classifier. REFERENCES [1]B. Blankertz, G. Dornhege, M. Krauledat, K.-R. Müller, and G. Curio, ‘‘The non-invasive Berlin brain–computer interface: Fast acquisition of effective performance in untrained subjects,’’ Neuroimage, vol. 37, no. 2, pp. 539– 550, Aug. 2007. [8]G.-B. Huang, Q.-Y. Zhu, and C.-K. Siew, ‘‘Extreme learning machine: Theory and applications,’’ Neurocomputing, vol. 70, nos. 1–3, pp. 489–501, 2006 [9]E. D. Ubbeyli, "Lyapunov exponent/probabilistic neural networks for analysis of EEG signal", Expert Systems with Applications, Vo1.37, pp.985-992, 2009 . [2]C. Brunner, N. Birbaumer, B. Blankertz, C. Guger, A. Kübler, and D. Mattia, ‘‘BNCI Horizon 2020: Towards a roadmap for the BCI community,’’ Brain-Comput. Interfaces, vol. 2, no. 1, pp. 1–10, Feb. 2015. [10]K. Polat, S. Gunes, "artificial immune recognition system with fLlZzy resource allocation mechanism classifier, principal component analysis and FFT method based new hybrid automated identification system for classification of EEG signals", Expert Systems with Applications, Vo1.34, pp.2039-2048, 2007 [3]K. K. Ang and C. Guan, ‘‘EEG-based strategies to detect motor imagery for control and rehabilitation,’’ IEEE Trans. Neural Syst. Rehabil. Eng., vol. 25, no. 4, pp. 392– 401, Apr. 2017. [11]Digital Signal Processing Handbook, Chapman & Hall/ CRC Press LLC, London, 1999, pp. 336-337 [4]R. Li, T. Potter, W. Huang, and Y. Zhang, ‘‘Enhancing performance of a hybrid EEG-fNIRS system using channel selection and early temporal features,’’ Frontiers Hum. Neurosci., vol. 11, p. 462, Sep. 2017. [12]V. P. Nigam, D. Graupe, "A neural-network-based detection of epilepsy", Neurol. Res., Vo1.26, pp. 55-60, 2004 [5]F. Lotte, M. Congedo, A. Lécuyer, F Lamarche, and B. Arnaldi, ‘‘A review of classification algorithms for EEG- based brain–computer interfaces,’’ J. Neural Eng., vol. 4, no. 2, pp. R1–R13, Jan. 2007. [13]G. Pfurtscheller, C. Neuper, D. Flotzinger, and M. Pregenzer, "EEGbased imagination of right and left hand movement," Electroencephalogr. Clin. Neurophysiol., vol. 103, no. 6, pp. 642-651, 1997. discrimination between [6]Q. She, H. Gan, Y. Ma, Z. Luo, T. Potter, and Y. Zhang, ‘‘Scale-dependent signal dimensional subspace: classification,’’ Neural Plasticity, vol. 2016, p. 7431012, Nov. 2016. identification Motor in low- task imagery [14]G. Pfurtscheller and F. H. Lopes da Silva, "Event-related EEG/MEG synchronization and desynchronization: basic principles," Clin. Neurophysiol., vol. 110, no. 11, pp. 1842-1857, Nov. 1999. @ IJTSRD | Unique Paper ID - IJTSRD23355 | Volume – 3 | Issue – 3 | Mar-Apr 2019 Page: 1445