Download
1 / 22
220 likes | 242 Vues
Study on diagnosing kappa distributions in the solar corona using polarized microwave gyroresonance radiation, with simulations, observations, and model parameters.

E N D
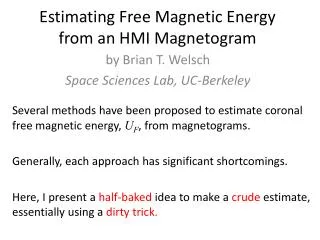
Diagnosing kappa distribution in the solar corona with the polarized microwave gyroresonance radiation Alexey A. Kuznetsov1, Gregory D. Fleishman2 1Institute of Solar-Terrestrial Physics (Irkutsk, Russia ) 2New Jersey Institute of Technology (Newark, USA)
Gyroresonance radiation • Produced by thermal electrons in strong magnetic fields above sunspots. • “Slowly varying component” of the solar radio emission. • Typical frequencies: ~ 1 – 10 GHz. • Demonstrates a high correlation with the sunspot number. SDO AIA 171 Å SDO HMI magnetogram Images of the Sun at different wavelengths, observed on 2011-08-01, 03:13 → SSRT 5.7 GHz I SSRT 5.7 GHz V
Gyroresonance radiation Equation of radiation transfer: For thermal electrons (β << 1), gyroemission (and absorption) is significant only in narrow layers with f ≈ sfB, s = 1, 2, 3, ... For Maxwellian distribution (e.g., Zheleznyakov 1970): Under the typical coronal conditions, gyrolayers with s ≤ 3 are optically thick (τ >> 1) and gyrolayers with s > 3 are transparent (τ << 1) the observed emission is produced at the 3rd gyrolayer.
Gyroresonance radiation from kappa-distributions Gyroresonance radiation theory was extended to kappa-distributions (Fleishman & Kuznetsov 2014). Optical depth of the s-th gyrolayer: Emission intensity from the s-th gyrolayer: Relative optical depths for the kappa-distribution. The factor R describes deviation from the Kirchhoff’s law. • For s > 2, optical depth for the kappa-distribution is larger than for Maxwellian one (and increases with decreasing κ). • In the optically thick regime (τ >> 1), the brightness temperature still increases with increasing optical depth. Brightness temperature vs. optical depth.
Gyroresonance radiation from kappa-distributions For the 3rd gyrolayer and viewing angle θ = 60°, the ratio of optical depths is τO / τX ≈ 0.04. Polarization degree Brightness temperature Maxwellian distribution κ = 10
Gyroresonance radiation from kappa-distributions Simulated gyroresonance emission spectra (for a typical magnetic field and plasma profile): Emission intensity Polarization degree
2012-05-08 2012-05-09 2012-05-10 2012-05-11 2012-05-12 2012-05-13 2012-05-14 2012-05-15 Diagnosing kappa-distributions in the solar active regions • Indicators of kappa-distribution: • Qualitative effect: optically thick gyroresonance emission has a significant polarization (detection requires high spatial resolution). • Quantitative effect: polarization of low-resolution microwave images is higher than predicted by the Maxwellian model (detection requires to know the magnetic field structure and plasma distribution). Selection criteria of the active region: • Simultaneous observations with SDO and SSRT. • Observation time near local noon and near the summer solstice at the SSRT location. • Large area / simple structure. Selected active region: AR 11476 (observed in May 2012). • Siberian Solar Radio Telescope (SSRT). • Working frequency: 5.7 GHz. • Spatial resolution: up to 21’’.
Simulations of gyroresonance radiation with GX Simulator Magnetic field structure. Plasma density distribution. 2012-05-11 02:44 GX Simulator (Nita et al. 2015, 2017). Magnetic field extrapolation: Weighted Optimization Nonlinear Force-Free Field reconstruction (Wiegelmann 2004), implementation by A.S. Stupishin (Fleishman et al. 2017); based on vector SDO magnetograms. Plasma code: Enthalpy-Based Thermal Evolution of Loops (EBTEL, Klimchuk et al. 2008; Bradshaw & Cargill 2010, Cargill et al. 2012a,b). Heating rate: Top view of the active region.
Simulation results: high-resolution images Brightness temperature Stokes I, 5.7 GHz Polarization degree Stokes V, 5.7 GHz
Fitting algorithm Before comparison with the observations, the simulated images must be convolved with the instrument response function. For a known magnetic field structure, the simulated microwave emission depends on two parameters: base heating rate Q0 and kappa-distribution index κ. 1) For each observation time and the value of κ, find the parameter Q0 that provides the best agreement of the observed and simulated intensity (Stokes I) maps: 2) For each observation time, find the value of κ that provides the best agreement of the observed and simulated polarization (Stokes V) maps:
Simulations vs. observations: 2012-05-11 Model parameters: • Maxwellian distribution; • Q0 = 5500. Stokes I, 5.7 GHz Stokes I, 5.7 GHz ηmax = -5.9% ηmax = -0.8% Stokes V, 5.7 GHz Stokes V, 5.7 GHz Observed images Simulated images
Simulations vs. observations: 2012-05-11 Model parameters: • κ = 10; • Q0 = 1500. Stokes I, 5.7 GHz Stokes I, 5.7 GHz ηmax = -5.9% ηmax = -2.3% Stokes V, 5.7 GHz Stokes V, 5.7 GHz Observed images Simulated images
Simulations vs. observations: 2012-05-11 Agreement between the simulations and observations vs. κ:
Simulations vs. observations: 2012-05-08 Model parameters: • Maxwellian distribution; • Q0 = 21000. Stokes I, 5.7 GHz Stokes I, 5.7 GHz ηmax = -7.8% ηmax = -0.6% Stokes V, 5.7 GHz Stokes V, 5.7 GHz Observed images Simulated images
Simulations vs. observations: 2012-05-08 Model parameters: • κ = 14; • Q0 = 10000. Stokes I, 5.7 GHz Stokes I, 5.7 GHz ηmax = -7.8% ηmax = -7.1% Stokes V, 5.7 GHz Stokes V, 5.7 GHz Observed images Simulated images
Simulations vs. observations: 2012-05-08 Agreement between the simulations and observations vs. κ:
Simulations vs. observations: 2012-05-14 Model parameters: • Maxwellian distribution; • Q0 = 50000. Stokes I, 5.7 GHz Stokes I, 5.7 GHz ηmax = -33.3% ηmax = 6.2% Stokes V, 5.7 GHz Stokes V, 5.7 GHz Observed images Simulated images
Simulations vs. observations: 2012-05-14 Model parameters: • κ = 7; • Q0 = 9500. Stokes I, 5.7 GHz Stokes I, 5.7 GHz ηmax = -33.3% ηmax = 25.1% Stokes V, 5.7 GHz Stokes V, 5.7 GHz Observed images Simulated images
R L R R L L Escape of radiation If the magnetic field is nearly perpendicular to the line-of-sight, even small variations of the field direction can affect the observed polarization sign.
Simulations vs. observations: 2012-05-14 Agreement between the simulations and observations vs. κ:
Simulations vs. observations: AR 11476 • Best agreement is achieved: • for Stokes I maps: for the Maxwellian distribution; • for Stokes V maps: • in the eastern hemisphere: for the Maxwellian distribution; • in the western hemisphere: for κ≈ 7 – 20; • for ηmax: for κ≈ 7 – 20 (except of two cases near the disk center).
Conclusions • Gyroresonance microwave emission is a powerful diagnosing tool for kappa-distributions in the solar corona; polarization of the emission is especially sensitive to the distribution type; however, it is also sensitive to other minor details of the model, such as the magnetic structure and the heating law. • We have computed the gyroresonance emission for the solar active region AR 11476 for different κ indices with the GX Simulator code and compared the results with the observations of the Siberian Solar Radio Telescope. • The best agreement of the simulated and observed intensity maps is achieved for the Maxwellian distribution (or for κ well above 20). • Comparison of the simulated and observed polarization maps are not yet conclusive in terms of the favorable kappa-index: • Sometimes, the simulations/observations favor the presence of kappa-distribution (with κ≈ 7 – 20). • Different comparison criteria favor different indices. • The simulations are not yet perfect enough to reproduce the structure of the polarization maps in detail. • Ways to improve the diagnostic capability of the microwave observations: • Using more accurate models of the magnetic field and plasma in the active regions. • Improving spatial resolution of the radio telescopes. • Using multi-wavelength microwave observations (SRH, EOVSA, MUSER).