
SlideServe
Menu
Préférences
© SlideServe · v2026

Understanding Earth's Magnetic Field: Magnetometer Data Analysis at IRF

jtighe avatar
26 diapositives · 563 Views · Jan 07, 2020

Learn about the measurement of ionospheric activity, auroras, and magnetic field components with real-time data. Discover the equipment used and the significance of monitoring Earth's magnetic field dynamics.
Understanding Earth's Magnetic Field: Magnetometer Data Analysis at IRF - slide 1
01 / 26Understanding Earth's Magnetic Field: Magnetometer Data Analysis at IRF
1 / 17

Télécharger la présentation

Understanding Earth's Magnetic Field: Magnetometer Data Analysis at IRF
Une image / un lien ci-dessous est fourni (tel quel) pour télécharger la présentation

Politique de téléchargement : le contenu du site vous est fourni TEL QUEL pour votre information et votre usage personnel ; il ne peut être vendu, concédé sous licence ni partagé sur d’autres sites sans l’accord de son auteur.Le contenu vous est fourni TEL QUEL, pour votre information et votre usage personnel uniquement. Téléchargez la présentation en cliquant sur ce lien. Lors du téléchargement, si vous ne parvenez pas à télécharger une présentation, l’éditeur a peut-être supprimé le fichier de son serveur.Pendant le téléchargement, si vous ne parvenez pas à obtenir une présentation, le fichier a peut-être été supprimé par l’éditeur.

F I N

Plus de contenu associé

Transcription de la présentation
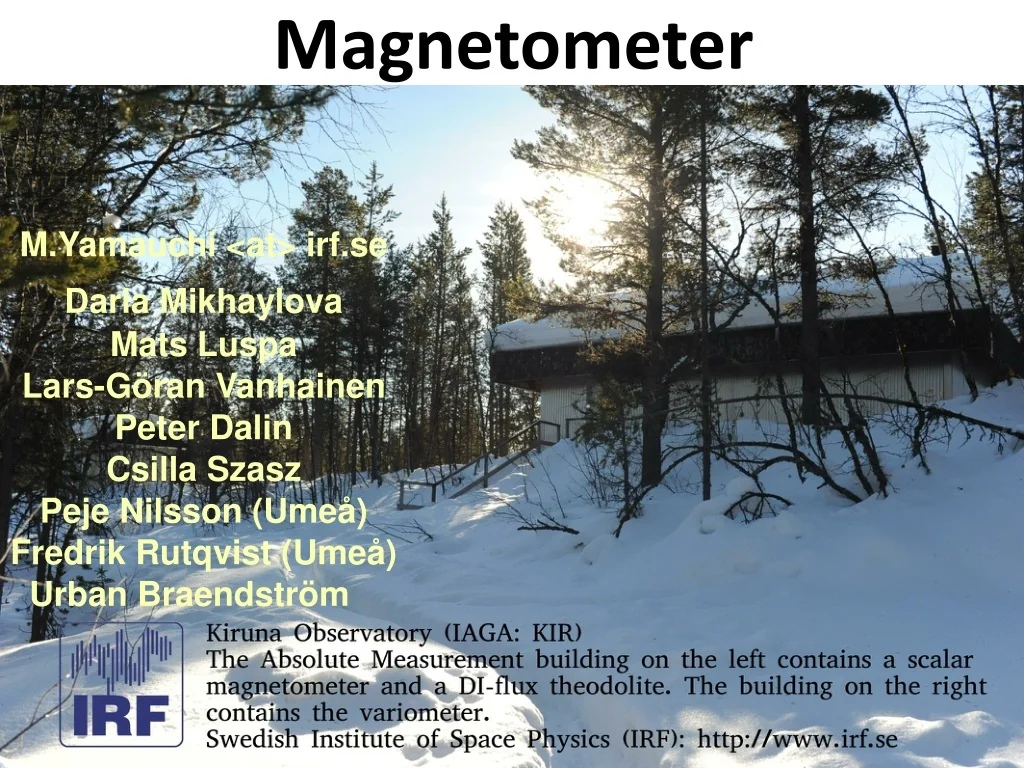
  1. Magnetometer M.Yamauchi <at> irf.se Daria Mikhaylova Mats Luspa Lars-Göran Vanhainen Peter Dalin Csilla Szasz Peje Nilsson (Umeå) Fredrik Rutqvist (Umeå) Urban Braendström 1

  2. Magnetic observatories IRF owns SGU took over from IRF

  3. Why do we measure Ionospheric activity aurora ~ current ~ conductivity etc. Earth evolution dynamo ~ polarity change Ground current spaceweather & condctivity

  4. Real-time page keogram Magnetogram aurora northward component (BX) eastward component (By) vertical downward component (BZ) http://www.irf.se/mag

  5. keogram Proccesed page northward component (BX) Magnetogram http://www.irf.se/mag eastward component (By) vertical downward component (BZ)

  6. Coordinate System Measurement: Horizontal-Declination-Inclination convert to XYZ Horizontal plane Vertical plane

  7. How to measure (equipment)

  8. What do we have at Kiruna? Vector field (1 sec): Flux gate magnetometer # Primary # Secondary (but just call “backup”) Absolute measurement (weekly): DI flux magnetometer # in operation # spair Total field = scalar value (every 4 sec): Proton magnetometer # in operation # spair Higher frequency than 1 Hz: Pulsation magnetometer # 3 sensors (XYZ) in oparation # one spair We also have a set at Lycksele, which is operated in collaboration with SGU

  9. Main building Variometer FGE 91 DMI

  10. Absolute House Proton magnetometer GSM-90 Gem Sys DI-flux DMI Zeiss Jena Backup GemSys och MinGeo

  11. Other magnetometers Pulsations Magnetometer Backup EDA 85B/94B UiT

  12. Proton Magnetometer Fluxgate Magnetometer

  13. Why do we measure Ionospheric activity aurora ~ current ~ conductivity etc. Earth evolution dynamo ~ polarity change Ground current spaceweather & condctivity

  14. Aurora ~ Magnetic field

  15. Old time without digital archive 1-hour values or 3-hour range index (K) for “digital data” K ~log(∆B) Running average of local K index 1962 1970 1980 1990 2000 2010

  16. Problem is baseline (due to convection) Sq curve 0 UT 12 UT 24 UT Raw data – Sq curve

  17. But, absolute measurement is difficult because we must measure the offset ! 2000 2005 2010 2015

  18. Another reason for absolute measurement 11200 nT northward (BX) 10600 nT 1980 1990 2000 2010 0 nT eastward (By) Kiruna By  0 ! -1400 nT 52000 nT vertical downward (BZ) 50600 nT 1980 1990 2000 2010

  19. Earth evolution

  20. Magnetic observatories with Invariant Latitude counter (h=200km)

  21. Large-scale induction current > 100 km scale high conductance 1. Electric power line  high grid stress 2. Searching underground property using auroral energy

  22. 3D plot (quiet day) Lycksele Kiruna quiet day trajectories

  23. 3D plot (disturbed day) Kiruna disturbed day trajectory

  24. 25