Download
1 / 24
240 likes | 412 Vues
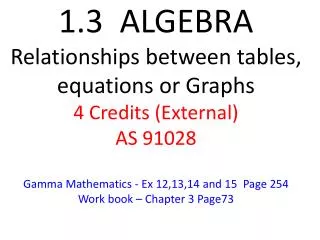
Equations, Tables, Or Graphs – Which is Better?. Equations, Tables, Graphs Which Is Better?. Essential Question: Which tells me more about the relationship I am investigating – a table, a graph or a formula or equation? Lesson Objective: To write equations,

E N D
Equations, Tables, Graphs Which Is Better? Essential Question: Which tells me more about the relationship I am investigating – a table, a graph or a formula or equation? Lesson Objective: To write equations, make tables, and make graphs to represent a situation.
Mrs. Nelson and Ms. Marques own an interior design business. They charge a $100 fee in addition to $40 an hour for interior design & window treatment consultations. Write an algebraic equation for the cost of an interior design consultation with Decorating Divas. Algebraic Equation / Formula: Cost = Fee + Cost per hour (# of hours) C = $100 + $40 (h) This equation shows how the cost of consulation depends on the # of hours the designers spend at your home.
Make a list to figure out the cost of a consultation lasting 1, 2, 3, and 4 hours using the equation we just wrote. Hours 1 2 3 4 C = $100+$40(h) 100+40(1) = 100+40 100+40(2) = 100+80 100+40(3) = 100+120 100+40(4) = 100+160 Cost $ 140 $ 180 $ 220 $ 260 The COST is the DEPENDANT VARIABLE because The cost depends on how many hours we are at the House. The HOURS would be the INDEPENDENT VARIABLE because it does not depend on anything else.
A dependent variable is the OUTPUT. It is what happens as a result of changes in the other variable. An independent variable is the INPUT. It does not depend on anything. These values can be chosen at random. Hours 1 2 3 4 C = $100+$40(h) 100+40(1) = 100+40 100+40(2) = 100+80 100+40(3) = 100+120 100+40(4) = 100+160 Cost $ 140 $ 180 $ 220 $ 260 Input - Output Table
The data in the Input-Output Table can be written as ordered pairs and graphed on a grid to show how the two variables relate to each other. Ordered Pair (h, Cost) (1, $ 140) (2, $ 180) (3, $ 220) (4, $ 260) Hours 1 2 3 4 Cost $ 140 $ 180 $ 220 $ 260 When we are graphing data, we place the INDEPENDENT VARIABLE on the x-axis and the DEPENDENT VARIABLE on the y-axis.
Graph the ordered pairs on a grid. Label the x-axis “hours” and the y-axis “cost of consultation”. Ordered Pairs (h, Cost) (1, 140) (2, 180) (3, 220) (4, 260) 500 400 300 200 100 0 C O S T ($) 0 1 2 3 4 5 6 h (hours of consulting)
Equations, Tables, Graphs Which Is Better? C = $100 + $40(h) Ordered Pairs (h, Cost) (1, 140) (2, 180) (3, 220) (4, 260) 500 400 300 200 100 0 C O S T ($) 0 1 2 3 4 5 6 h (hours of consulting)
A survey by a magazine found that the average cost of a baby-sitter in Atlanta in 1994 was $3 per hour. Write an algebraic equation for the cost of a babysitter if a tip of $2 is given. Algebraic Equation / Formula: Cost = Tip + Cost per hour (# of hours) C = $2 + $3 (h) This equation shows how the cost of the sitter depends on the # of hours the sitter was caring for the kids.
Make a list to figure out the cost of a babysitter for 3, 6, 9, and 12 hours of babysitting using the equation we just wrote. Hours 3 6 9 12 C = $2 + $3(h) 2 + 3(3) = 2+9 2 + 3(6) = 2+18 2 + 3(9) = 2+27 2 + 3(12) = 2+36 Cost $ 11 $ 20 $ 29 $ 38 The COST is the DEPENDANT VARIABLE because The cost depends on how many hours the sitter will be there. The HOURS would be the INDEPENDENT VARIABLE because it does not depend on anything else.
A dependent variable is the OUTPUT. It is what happens as a result of changes in the other variable. An independent variable is the INPUT. It does not depend on anything. These values can be chosen at random. Hours 3 6 9 12 C = $2 + $3(h) 2 + 3(3) = 2+9 2 + 3(6) = 2+18 2 + 3(9) = 2+27 2 + 3(12) = 2+36 Cost $ 11 $ 20 $ 29 $ 38 Input - Output Table
The data in the Input-Output Table can be written as ordered pairs and graphed on a grid to show how the two variables relate to each other. Ordered Pair (h, Cost) (3, $ 11) (6, $ 20) (9, $ 29) (12, $ 38) Hours 3 6 9 12 Cost $ 11 $ 20 $ 29 $ 38 When we are graphing data, we place the INDEPENDENT VARIABLE on the x-axis and the DEPENDENT VARIABLE on the y-axis.
Graph the ordered pairs on a grid. Label the x-axis “hours” and the y-axis “cost of babysitter”. Ordered Pairs (h, Cost) (3, 11) (6, 20) (9, 29) (12, 38) C O S T Of S I T T E R ($) 50 40 30 20 10 0 0 4 8 12 16 20 24 h (hours of baby sitting)
Equations, Tables, Graphs Which Is Better? C O S T Of S I T T E R ($) 50 40 30 20 10 0 0 4 8 12 16 20 24 h (hours of baby sitting) C = $2 + $3 (h) TABLE (h, Cost) (3, 11) (6, 20) (9, 29) (12, 38)
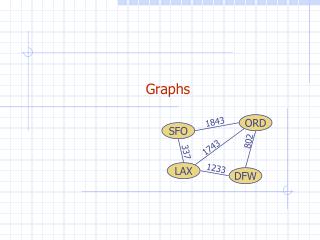
What is a function? A function is a relationship in which each member of one set is paired with exactly one member of another set.
What is a function? A function is a relationship in which each member of one set is paired with exactly one member of another set. Linear functions form a straight line when graphed in the coordinate plane.
Function Machine Input(X) Output(Y) 1 7 What’s the pattern What’s the relationship?
Function Machine Input(X) Output(Y) 4 28 What’s the pattern What’s the relationship?
Function Machine y = 7x Input(X) Output(Y) 10 70 What’s the pattern What’s the relationship?
Function Machine Input(X) Output(Y) 3 7 What’s the pattern What’s the relationship?
Function Machine Input(X) Output(Y) 5 11 What’s the pattern What’s the relationship?
Function Machine y = 2x + 1 Input(X) Output(Y) 7 15 What’s the pattern What’s the relationship?
Function Machine • We can take information from a word problem and… • Write an equation or rule for the problem • Make an input-output table (also called a • function table) • Make a graph with the input on the x-axis • and output on the y-axis
Function Machine Input(X) Output(Y) http://www.ixl.com/math/grade-6/write-linear-functions http://www.mathplayground.com/functionmachine.html