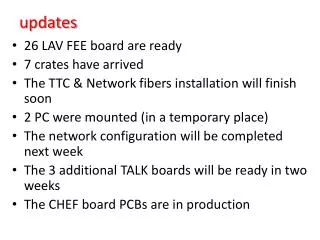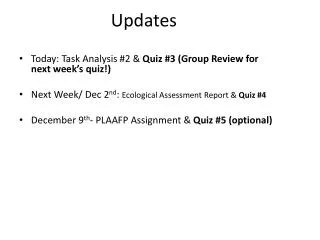
Updates
Updates. Mr Tritch’s Chart. Mr Tritch’s Chart. Mr Tritch’s Chart. Fundamental Analysis : P/E Ratio PEG Ratio % Dividend Yield Return on Equity Debt / Equity Ratio -----------------------------------------------------------

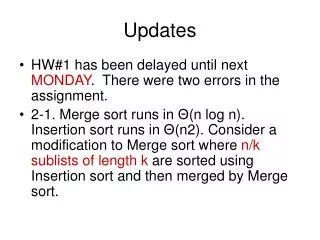
Updates
E N D
Presentation Transcript
Fundamental Analysis: P/E Ratio PEG Ratio % Dividend Yield Return on Equity Debt / Equity Ratio ----------------------------------------------------------- “WHAT” to Buy / Sell
Technical Analysis: Price (OHLC) Volume (V) ----------------------------------------------------------- “WHEN” to Buy / Sell
Dennis Atkins - Courier Mail – 09/03/2013Financial Analysts have to explain 2 things when they wake up in the morning. • # 1. • # 2.
Dennis Atkins - Courier Mail – 09/03/2013Financial Analysts have to explain 2 things when they wake up in the morning. • # 1. What is going to happen today ? • # 2.
Dennis Atkins - Courier Mail – 09/03/2013Financial Analysts have to explain 2 things when they wake up in the morning. • # 1. What is going to happen today ? • # 2. Why they got it wrong yesterday ?
PRICE ACTIONand VOLUME ~~~~~~~~~~~~~~~~~~~~~~~~~~~~~~~ QIC Meeting March 2013 Speaker: Victor Harling
Range Narrow Wide ---------------------------------------------------------------------------- • Volume Low High
Range ---------------------------------------------------------------------------- • Volume
Correlation ( Range, Volume, Time ) • Positive - - - > + 1 • Zero - - - > 0 • Negative - - - > - 1
Range (-1)-----------------0----------------(+1) • Volume
CorrelationXJO (200 Stocks) - 1 year = ------------------------------------------------------------------ Range Volume
CorrelationXJO (200 Stocks) - 1 year = 0.39 [ RR = 0.15 - 0.73 ] ------------------------------------------------------------------ Range Volume
CorrelationXJO (200 Stocks) - 1 year = 0.39 [ RR = 0.15 - 0.73 ] ------------------------------------------------------------------ Range Volume
CorrelationXJO (200 Stocks) - 1 year = 0.39 [ RR = 0.15 - 0.73 ] ------------------------------------------------------------------ Range Volume
CorrelationXJO (200 Stocks) - 1 year = 0.39 [ RR = 0.15 - 0.73 ] ------------------------------------------------------------------ Range Volume
CorrelationXJO (200 Stocks) - 1 year = 0.39 [ RR = 0.15 - 0.73 ] ------------------------------------------------------------------ Range Volume
CorrelationXJO (200 Stocks) - 1 year = 0.39 [ RR = 0.15 - 0.73 ] ------------------------------------------------------------------ Range Volume
CorrelationXJO (200 Stocks) - 1 year = 0.39 [ RR = 0.15 - 0.73 ] ------------------------------------------------------------------ Range Volume
Range (-1)------------------0---xxxxxxxxx----(+1) • Volume
Assumption HIGH Volume + WIDE Range =
Assumption HIGH Volume + WIDE Range = Major Trading Activity (Buying / Selling)
Range (-1)------------------0---xxxxxxxxx----(+1) • Volume
Range[Wide] • Volume [High]
Range[Wide] • Volume [High]
Resistance Supply Selling • Range[Wide] • Volume [High] Support Demand Buying
Resistance Supply Selling • Range[Wide] • Volume [High] Support Demand Buying
Up • Range[Wide] • Volume [High]
Range[Wide] • Volume [High] Neutral
Range[Wide] • Volume [High] Down
Up • Range[Wide] • Volume [High] Neutral Down