Drought Modeling Experiments
Drought Modeling Experiments . Alfredo Ruiz-Barradas & Sumant Nigam University of Maryland. 12 th Annual CCSM Workshop Breckenridge, CO June 19-21, 2007. US CLIVAR DROUGHT WORKING GROUP. Co-Chairs Sigfried Schubert (NASA/GSFC) David Gutzler (U of New Mexico).

Drought Modeling Experiments
E N D
Presentation Transcript
Drought Modeling Experiments Alfredo Ruiz-Barradas & Sumant Nigam University of Maryland 12th Annual CCSM Workshop Breckenridge, CO June 19-21, 2007
US CLIVAR DROUGHT WORKING GROUP Co-Chairs Sigfried Schubert (NASA/GSFC) David Gutzler (U of New Mexico) Objective: The primary objective of this working group is to facilitate progress on the understanding and prediction of long-term (multi-year) drought over North America and other drought-prone regions of the world, including an assessment of the impact of global change on drought processes. Slides/Results extracted from presentations/analyses at: http://www.usclivar.org/Organization/drought-wg.html
Droughts, a Global Phenomenon Drought is a global phenomenon, both in terms of the forcing elements and the potential commonality of local processes that operate to make some regions more susceptible to drought than others. As such, confidence in our understanding of drought processes (remote and local forcing, feedbacks, etc.) will be significantly advanced by efforts to properly analyze and simulate regional drought wherever it occurs. Recent studies (e.g., Hoerling and Kumar 2003; Schubert et al. 2004; Seager et al. 2005) suggest that such simulations are feasible using current global models. There are, however, still major uncertaintiesabout the relative roles of the different ocean basins, the strength of the land-atmosphere feedbacks, the role of deep soil moisture, the nature of long-term SST variability, the impact of global change, as well as fundamental issues about predictability of drought on multi-year time scales.
Steps to be taken • Propose a working definition of drought and related model predictands of drought: e.g.,multy-year dry periods from annual precipitation, PDSI, etc. • Coordinate evaluations of existing relevant model simulations: CLIVAR’s DRICOMP. • Suggest new experiments (coupled and uncoupled) designed to address some of the outstanding uncertainties mentioned above: this design initiative. • Coordinate and encourage the analysis of observational data sets to reveal antecedent linkages of multi-year drought. • Organize a community workshop to present and discuss the results.
Proposed Model Simulations The idea is for several modeling groups(NCAR?) to do identical (somewhat idealized) experiments to address issues of model dependence on the response to SSTs (and the role of soil moisture), and to look in more detail at the physical mechanisms linking the SST changes to drought PARTICIPANTS -Max Suarez, NASA/GSFC -Marty Hoerling, NOAA/CDC -Randy Koster, NASA/GSFC -Kingtse Mo, NOAA/CPC -Jae Schemm, NOAA/CPC -Alfredo Ruiz-Barradas, U of Maryland -Dave Gutzler, U of New Mexico -Sumant Nigam, U of Maryland -Siegfried Schubert, NASA/GSFC -Richard Seager, Columbia U/LDEO -Mingfang Ting, Columia U/LDEO -Rong Fu, Georgia Institute of Tech. -David Rind, NASA/GISS -Tom Delworth, NOAA/GFDL -Arun Kumar, NOAA/CPC -Phil Pegion, NASA/GSFC
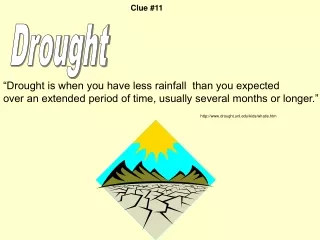
Observational record tells… • Multi-year dry patterns are linked with SST variability (in the absence of other mechanisms, such as soil moisture memory).
Leading REOFs and Time series (annual mean SST - 1901-2004) Linear Trend Pattern (LT) Pacific Pattern (Pac) Atlantic Pattern (Atl)
Highest Priority: impact of the leading three patterns (LT, Pac, Atl) Vanilla-style AMIP experiments -prescribe each pattern on top of seasonally varying SST climatology - each run should be at least 51 years (first year is spin-up) -need a 50+ year control with climatological SST 1) Pac and Atl patterns a) All combinations of patterns (8 X 50 years =400 years of simulation) 2) Runs involving the LT pattern a) +/- LT pattern b) +/- LT added to (Pac- and Atl+) c) +/- LT added to (Pac+ and Atl-) (6 X 50 years = 300 years of simulation) 3) Uniform SST warming pattern that has the same global mean SST as + LT (0.16° added to climatology) (1 X 50 years =50 years of simulation)
Other runs: 1) Tropical part of Pac and Atl patterns a) Tropical only +/-Pac and +/- Atl patterns (4X50 years =200 years of simulation) Tropical Pacific The tropical Pacific region is -21S to 21N, with a taper between 21 and 15. The anomaly is 0 at 21-degrees, 1/2 of the full anomaly at 18-degrees, and the full anomaly equator-ward of 15-degrees. Tropical Atlantic The edges of the box with the full anomalies were chosen as 88W to 13W, and 12 N to 18N. The anomalies were tapered linearly north and south, with latitudes 9N and 21N getting 1/2 the anomaly, and with the anomaly going to 0 at latitudes 6N and 24N.
Other runs: 2) Separate the impacts from low frequency and ENSO patterns in the Pacific +/- 2std of low frequency REOF 2 +/- 2std of residual REOF 1 (4X50 years = 200 years of simulation)
Other runs: 3) Soil moisture experiments Goal: To determine if the feedback of soil moisture on precipitation can amplify the magnitude of simulated droughts. a) Fix soil moisture. Ideally this would be based on an ensemble of C20C runs, but could also be from the suggested 1950+ runs. b) Redo runs in 1 and 2 with fixed (climatological) soil moisture, but taken from 50 year control with climatological SST
SST Forcing patterns to be provided (3.0 X 3.75 deg grid): http://www.usclivar.org/Organization/drought-wg.html -Pac, Atl, and LT SST anomalies anomalies are +/- 2 std for Pac and Atl anomalies are +/- 1 std for LT note that for uniform SST case add 0.16° to climatology 1901 to 2004 HadISST climatology on same grid -tropical part of Pac and Atl patterns low frequency Pacific pattern (REOF 2 of six-year filtered SST) ENSO pattern (REOF 1 after first removing six-year filtered variability)
Output for sharing -monthly mean Tsfc, precipitation, soil wetness, z200, u,v,q 850, evaporation, sensible heat flux, monthly mean atmospheric fluxes (uv,uq,vq,uT,vT, etc., -e.g. can save ubar,vbar and uvbar to get transients), sfc net radiation, total run-off, snow water equivalent, slp, monthly mean diurnal cycle (priority here is for Tsfc, precipitation, evaporation, sensible heat flux, net radiation, lower tropospheric winds and fluxes), (also will need to save soil moisture in each layer if you plan to do the soil moisture experiments) -encourage saving daily fields Sharing output -A GrADS-DODS Server that can easily handle all the monthly fields Some common/coordinated analysis of the runs (ideas?) -Randy’s analysis of drought index -changes in variance/predictability -validation/verification of mechanisms
Long Term Goal • Can NCAR perform all of these runs with the latest CAM3.5? If not, which ones? Some others? How long will it take? • To have results for the joint DRICOMP/USCLIVAR drought workshop some time next year. • We will learn much from these runs, both about the differences in the models and about the mechanisms by which the SST anomalies can lead to drought (and pluvial) conditions over North America and elsewhere.