Download
1 / 24
240 likes | 362 Vues
Explore the essential concepts and methods of inferential statistics in the geographical context, focusing on classical hypothesis testing, P-value hypothesis testing, and one-sample tests for means and proportions. Learn how statistical hypotheses are formulated, tested, and interpreted to make decisions about unknown population parameters. Gain insights into selecting appropriate tests based on sample data and understanding the principles of hypothesis testing in geography.

E N D
Chapter 8 McGrewElements of Inferential StatisticsDave MuenkelGeog 3000
Outline • Classical Hypothesis Testing • P-Value Hypothesis Testing • One Sample Difference of Means Test • One Sample Difference of Proportions Test • Issues in Inferential Testing / Test Selection
Hypothesis • A statistical hypothesis is simply a claim about a population that can be put to the test by drawing a random sample
Hypothesis Testing in Geography • Make statements regarding unknown population parameter values based on sample data in order to: - Refine Spatial Models - Develop Laws and Theories • A properly created sample is essential to Inferential Statistics
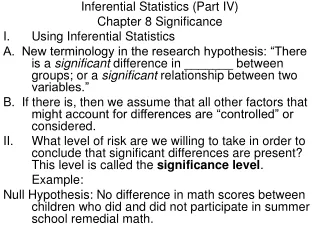
Classical Hypothesis Test • Steps: • State Null Hypothesis - Statement regarding the value of an unknown parameter. Usually implies no association between explanatory and response variable. • State Alternative Hypothesis - Statement contradictory to the null hypothesis. • Select Test Statistic - Quantity based on sample data and null hypothesis used to test between null and alternative hypotheses • Select Rejection Criteria – The value of the test statistic in which we reject the null or the alternative hypothesis • Calculate the Test Statistic • Make a Decision regarding the Hypothesis
State the Hypothesis The null hypothesis, Ho: Specifies hypothesized values for one or more of the population parameters The alternative hypothesis, HA: A statement which says that the population parameter is something other than the value specified by the null hypothesis
Null and Alternative Hypothesis The typical claim is that is equal to some value H (hypothesized mean). This claim of equality is called the Null Hypothesis. Ho: 1 - 2 = 0, or Ho: 1 = 2 The Alternative Hypothesis is the alternate Hypothesis and expresses the condition for rejecting the Null Hypothesis. HA: 1 - 2 0, or HA: 1 2 The two Hypotheses are mutually exclusive
Example Hypotheses • H0: μ1 = μ2 • HA: μ1 ≠μ2 • Two-sided test • HA: μ1 > μ2 • One-sided test
Type I and Type II Error State of the WorldHo AcceptedHo Rejected If Ho is true Correct decision Type I error Pr = 1- Pr = If Ho is false Type II error Correct decision Probability = Probability = 1 -
Select Level of Significance • If we want to have only a 5% probability of rejecting H0 if it is really true, then we say our significance level is 5%
Calculate Test Statistic Test Statistic:
Make a Decision The rejection of the null hypothesis implies the acceptance of the alternative hypothesis Involves Estimation Hypothesis Testing Purpose To make decisions about population characteristics
Compare Test Statistic to Rejection Region Upper-Tailed Lower-Tailed Two-Tailed
Make Decision on Hypothesis fail to reject reject reject (1 - a) a/2 a/2
P-value • The smallest α the observed sample would reject H0 • If H0 is true, probability of obtaining a result as extreme or more extreme than the actual sample • Is based on a model Normal, t, binomial, etc.
Determining Statistical Significance: P-Value Method • Compute the exact p-value (X.XX) • Compare to the predetermined α-level (0.05) • If p-value < predetermined α-level • Reject H0 • Results are statistically significant • If p-value > predetermined α-level • Do not reject H0 • Results are not statistically significant
Difference of Means / Proportions Test • Used to compare a mean / proportion from a random sample to the mean of a population. • Used to compare a mean / proportion from a random sample to the mean of a population. • Assume Normal Distribution • For Large Samples use Z-Score • For small samples less than 30, use Students t distribution
Degrees of Freedom • the number of values in the final calculation of a statistic that are free to vary • the minimal number of values which should be specified to determine all the data points • whenever a parameter must be estimated to calculate a test statistic, a degree of freedom is lost
Inferential Test Selection Consider - population of interest - investigative variables - sample data - inference about population based on sample data - reliability measure for the inference
Parametric and Non-parametric Tests • Parametric tests • for particular assumptions about the underlying population distributions • usually normal population is assumed • Non-Parametric Tests • may be used on any distribution • with nominal ordinal data--only non-parametric tests can be used