Download
1 / 32
320 likes | 464 Vues
This study explores the feasibility of micro siting for wind energy projects in mountainous terrains through physical modeling in a wind tunnel. The research, conducted at the Von Karman Institute and supported by various European institutions, focuses on accurately simulating atmospheric flows and the unique challenges of complex terrains. Key modeling aspects include turbulence characteristics, inlet conditions, and roughness parameters, assessed using advanced measurement techniques like Particle Image Velocimetry (PIV) and hot-wire anemometry. The investigation involved detailed case studies, notably in the Alaiz mountain region of Spain, to demonstrate the model's applicability.

E N D
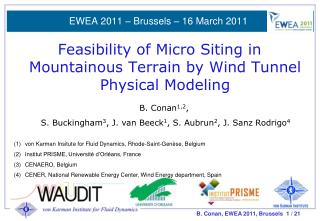
EWEA 2011 – Brussels – 16 March 2011 Feasibility of Micro Siting in Mountainous Terrain by Wind Tunnel Physical Modeling B. Conan1,2, S. Buckingham3, J. van Beeck1, S. Aubrun2, J. Sanz Rodrigo4 • von Karman Insitute for Fluid Dynamics, Rhode-Saint-Genèse, Belgium • Institut PRISME, Université d’Orléans, France • CENAERO, Belgium • CENER, National Renewable Energy Center, Wind Energy department, Spain
The WAUDIT project • Wind Resource Assessment Audit and Standardization European Commission Marie-Curie Initial Training Networks Pool of 18 PhD FP7-PEOPLE-ITN-2008
Physical modeling of atmospheric flows Pedestrian comfort: European parliament Aerodynamic design of the Belgium polar station Wind loading on buildings Pollution dispersion
Physical modeling assumptions • Modeling requirements (N-S equations): • undistorted scaling geometry • equal dimensionless inflow conditions • Ri (Richardson) • Ec (Eckert) • Pr (Prandtl): same fluid • Ro (Rossby): Coriolis effect neglected in the near surface • Re (Reynolds): cannot be conserved • Ensure fully turbulent state: Re > 10 000 • Minimum roughness Reynolds number: • Reynolds number dependency study if possible cst. temp. wind tunnel neutral stratification
Modeling assumptions • Modeling questions common to CFD and physical modelers: • reproduction of atmospheric inflow conditions • choice of the modeling area • choice of surface roughness / wall function • integration of the model in the domain • Specific topics for physical modeling: • Re number dependency • high scaling factors • choice of the measurement techniques
CENER - Test Case • Alaiz mountain, Pamplona, Spain: • 1 130 m high (600 m) • very complex terrain • steep slopes • dominant North wind • upstream ridge > 200m
CENER - Test Case • Mock-up in the wind tunnel: • 1 / 5000 scale (2.8 m wide x 3 m long) • one direction tested • Model realized by UPM (Universidad politechnica de Madrid, Spain)
Modeling inlet conditions • Parameters to reproduce: • velocity profile • roughness length ( ) • friction velocity ( )
Modeling inlet conditions • ABL generation: • grid • fence • adaptative roughness elements
Modeling inlet conditions • Parameters to reproduce: • velocity profile • roughness length ( ) • friction velocity ( ) • turbulent profiles (3 components) • turbulent spectra • Need for 3 components time resolved measurements
Modeling inlet conditions • Triple hot-wire probe • punctual measurement • U, V, W, u, v, w, u’, v’, w’ • Iu, Iv, Iw • TKE • shear stress:
Modeling inlet conditions • Alaiz inlet conditions: Wind tunnel can model different roughness length and scales Inflow reproduction challenging at very high scaling factor
Particle Image Velocimetry (PIV) • 2D instantaneous velocity field (U, W) • high spacial resolution: 150mm x 150mm with 2mm = 10m resolution • 500 images to perform averaging
Particle Image Velocimetry (PIV) • Averaged fields: • velocity field • turbulence intensity • velocity vector • Instantaneous fields: • velocity field • shear stress • vorticity • vortex detection
Complementary measurement techniques Measurement error: Measurement error : PIV: 1.5% HW: 2% Statistical error: Averaged quantities: PIV: 1.5% (95% c.l.) HW: 1% (95% c.l.) Fluctuating quantities: PIV: 8% (95% c.l.) HW: 6% (95% c.l.) • PIV: • space resolution • 2 components • Hot-wire: • time resolution • 3 components High wind potential areas detection by PIV Fine characterization of the wind profile with triple hot-wire
Flow around the mountain • Velocity field: • speed-up at the top of the mountain • Turbulence intensity: • inlet perturbation • influence at mountain’s top • Velocity vector field: • perturbation of the inlet velocity profile • speed-up at mountain’s top
Flow around the mountain • Fractional Speed-up Ratio at 90m (FSR): Reference velocity Max speed up Recovery from the influence of the ridge Speed-down due to the mountain
Flow around the mountain • Comparison 2D CFD simulation: From: D. Munoz-Esparza et al. EWEA 2011, PO. 218 50% speed-up at the mountain’s top High influence of the front ridge
Conclusions and future investigations • Inflow conditions modeling: • the wind tunnel can model different ABL, it is more challenging at very high scaling factors. • characterization of all the inlet conditions possible to model in the wind tunnel. • Choice of the modeling area: • a ridge of 1/3 of the main mountain height and situated 4km upstream influences a lot the FSR. • parametric study with simplified geometries
Conclusions and future investigations • Measurement techniques: • combination of PIV and triple hot-wire very powerful. • implementation of Stereoscopic PIV (2D-3C) on Bolund • Remaining questions: • model roughness implementation Alaiz • comparison with field data Alaiz • Reynolds number dependency • Quantification of the influence of each parameter
Thank you for your attention References: [1]. Cermak, J.E. “Laboratory simulation of the Atmospheric Boundary Layer” AIAA Journal vol. 9 num. 9 pp1746-1754 (1971). [2]. Sanz Rodrigo, J., Van Beeck, J. and Dezsö Weidinger, G. “Wind tunnel simulation of 1the wind conditions inside bidimensional forest clear-cuts. Application to wind turbine siting” J. Wind Eng. Ind. Aerodyn. 95(7)609-634, 2007. [3]. Siddiqui, K., Hangan, H., Rasouli, A. “PIV technique implementation for wind mapping in complex topographies” Meas. Sci. Technol. 19 (2008) 065403 doi:10.1088/0957-0233/19/6/065403. [4]. ESDU Engineering Science Data Unit. Characteristics of atmospheric turbulence near the ground. 1985. [5]. VDI-guidelines 3783/12, 2000. Physical modelling of flow and dispersion processes in the atmospheric boundary layer – application of wind tunnels. Beuth Verlag, Berlin [6]. Raffel, M., Willert, C., Wereley, S. “Particle Image Velocimetry: a practical guide” Springer Verlag, 2007 [7]. Bruun, H.H., ”Hot-wire anemometry” Oxford University Press Oxford (2002) ISBN: 0198563426
The WAUDIT project • Wind Resource Assessment Audit and Standardization EU program: Marie-Curie Initial Training Networks Action FP7-PEOPLE-ITN-2008 • Scientific/Technical: Advance the state-of-the-art on wind assessment • Academic: Provide a multidisciplinary education around wind energy with specialization on wind resource assessment (18 PhDs)
Back-up • Modeling requirements (N-S equations):
Back-up • Pressure gradient • Fully developed flow • Two profiles at X and X+2m
Back-up Calibration with a 4th polynomial: Velocity components in the frame of the wires: Velocity in wind tunnel frame:
Modelling boundary conditions Velocity in wind tunnel frame:
Back-up Measurement error: Measurement error : PIV: 1.5% HW: 2% Statistical error: Averaged quantities: PIV: 1.5% (95% c.l.) HW: 1% (95% c.l.) Fluctuating quantities: PIV: 8% (95% c.l.) HW: 6% (95% c.l.) • PIV: • space resolution • 2 components • Hot-wire: • time resolution • 3 components High wind potential areas detection by PIV Fine characterization of the wind profile with triple hot-wire
Back-up Assessment of wind potential in complex terrain with high accuracy • field measurements: reality, but long, expensive and low resolution • linear models: limited to slopes < 30% • numerical simulation: (main area of research) high resolution, controlled boundary conditions, modeling all scales but also high level of modeling: need for precise validation Wind tunnel modeling: • constant conditions • space and temporal resolution • moderated level of modeling • Example on a mountainous terrain