Download
1 / 29
290 likes | 386 Vues
This presentation focuses on a practical approach for managing demand in managed lane facilities. It discusses tools such as electronic toll lanes and price management to ensure traffic flow. Various projects are highlighted, such as Maryland State Highway Administration projects and the Inter-County Connector. The post-processing methods include refining travel demand models and redistributing volumes based on capacity. The presentation details procedures, impacts, and measures of effectiveness for developing managed lane forecasts.

E N D
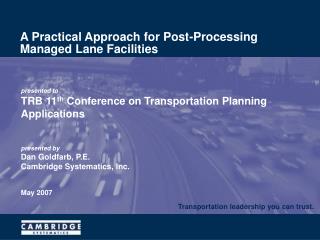
A Practical Approach for Post-Processing Managed Lane Facilities Transportation leadership you can trust. presented toTRB 11th Conference on Transportation Planning Applications presented byDan Goldfarb, P.E.Cambridge Systematics, Inc. May 2007
ETL Lanes • Electronic Toll Lanes • Tool for Managing Demand • Price to Keep Traffic Moving Guide for HOT Lane Development, FHWA,
ETL Projects • Maryland State Highway Administration Projects • Inter-County Connector (ICC) • Capital Beltway (I-495/I-95) • I-270 from I-70 to I-370 • Western Mobility I-495 to I-270 • Role - Developed Travel Demand Forecast
ETL Forecast Issues • Develop Year 2030 Forecast for the ICC • Toll Facility • Variable Tolls to Manage Demand • Guarantee Traffic Flow Reasonable LOS • Threshold LOS “C” to LOS “D” conditions – 1800 pcphpl • 6% HV, Rolling Terrain – 1650 vph • Open Process for EIS
Travel Demand Model • MWCOG V2.1C Travel Demand Forecast Model • Validated Study Corridor • Base year 2000 • No-Build Year 2030 • Tolls ― Travel Time Penalty Assignment
V2.1C Toll Application Improvements Trip Distribution • 4 Income Groups • Work & Non-Work Purposes Convert Toll Cost to Time Equivalent Assignment • Vehicle Cost • Vary Peak & Off-Peak Mode Choice • Average Cost by Purpose • Vary Peak & Off-Peak • Per Person Cost for HOV Source: MWCOG V2.1C User’s Guide & Technical Memorandum Oct-21-2003
Time & Cost Equivalents By Income Level & Purpose Source: MWCOG User’s Guide V2.1D #50 Model
Time & Cost Equivalents By Vehicle & Time Period Source: MWCOG User’s Guide V2.1D #50 Model
Toll Cost & Time 5.62 miles 3.45 miles
Travel Demand Forecast Model Assignment • Large Geographic Area • Coarse Network • Macro-level Assignment
Refinement of The Travel Demand Model Output • Post-Process • Applied at the link level • Procedures from NCHRP-255 • “Link Smoothing” • Benefits • Raw Assignment Capital Beltway RMSE 14% • Link Refinement Capital Beltway RMSE 6% • Annual Growth Factor RMSE 25%
Link Refinement • Part 1 – Model Bias • Ratio Adjustment • Difference Adjustment • Part 2 – Redistribution • Count factor • Capacity Factor
ETL — Managed Facility • Redistribution Problem • Capacity Based • Constraints: → Reflect Managed Nature of Facility → Reflect the Results of Model Run
Post-Processing Approaches for ETL Facility • Use the Raw Model Output • Limit ETL Facility to 1650 vphpl • Incorporate ETL Into the Link Refinement Procedure
ETL Raw Model Output Approach • Represent the Toll Impact on the Demand • Issue of Coarse Network – Loading Points • Macro ― Level Assignment Algorithm • Facility Open to All Traffic ― Over/Under
Fixed Volume Flow Approach • Limit the Volume 1650 vphpl • Redistribute the Surplus or Shortfall to other Parallel Competing Routes • Differs from Results of the Travel Demand Model Assignment • Not Reflecting the Cost of Toll – Pricing Question
Incorporating the ETL into the Link Refinement Approach • Redistribute Volumes Over the Cutline • Capacity & Count Factors • New Facility Impedance – Capacity • Adjust Capacity for the ETL Facility Reflect Demand
Capacity Adjustment • Freeway LOS “E” Capacity (2310 vphpl) • Apply Peak to Daily Ratio Factor (8%) ― Daily Capacity • Two Model Runs • Toll • Non-Toll • Adjust the ETL Capacity Based on the Ratio of the Raw Assignments for Toll & Non-Toll • Apply the Ratio to the LOS “E” Capacity for the ETL • Redistribute Volumes over the Cutline • Review Results – Adjust Toll Accordingly
Overview of Process Start Demand OK End Yes Set Toll Cost No Peak Off-Peak Evaluate Toll Demand Run TDFM Toll Run TDFM No Toll { Export Link Data Assign Links to Cutlines Calculate ETL Lane Capacity Volnon-toll × Capacity LOS E Voltoll NCHRP-255 Procedures
Results ICC Toll Volume: 68,986 vpd ICC No-Toll Volume: 127,723 vpd Capacity Reduction Factor: 52%
Summary • Developing ETL Forecast • Traditional 4-Step Travel Demand Forecast Model • Incorporate ETL Characteristics into NCHRP-255 Link Refinement Procedures • Redistribute the Link Volumes based on Capacity • Calculate the ETL Capacity Based on No-Toll and Toll Model Runs & Adjust ETL Capacity for Redistribution • Open Process for EIS Requirements • Report Regional Impacts & Measures of Effectiveness