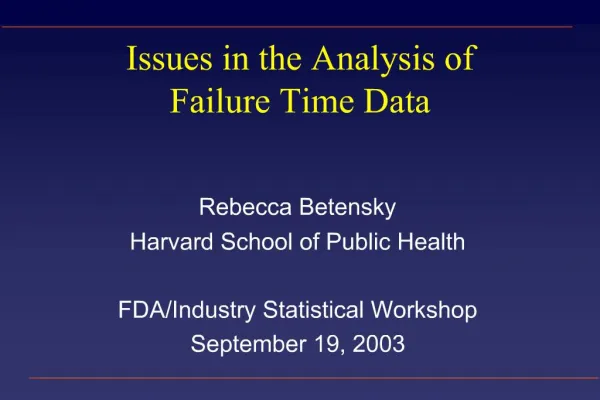
Issues in voxel-based analysis of PV-corrected data
100 likes | 222 Vues
This presentation, delivered by Mario Quarantelli at the HBM2004 Satellite Meeting in Budapest, addresses the complexities encountered in voxel-based analysis of partial volume corrected (PVC) data, particularly in neuroimaging studies. It discusses the importance of voxel smoothing, normalization processes, and the challenges of detecting regional differences in PET/SPET images. Preliminary results highlight the reintroduction of partial volume effects due to smoothing and alternative analytical techniques needed to accurately assess hypometabolism in atrophied regions.

Issues in voxel-based analysis of PV-corrected data
E N D
Presentation Transcript
Issues in voxel-based analysisof PV-corrected data Mario Quarantelli Biostructure and Bioimaging Institute – CNR Naples - Italy HBM2004 - PVEOut Satellite Meeting Budapest, 12 June 2004 IBB, 2004
Previous studies with voxel-based PV-C images have used voxel-based analysis to detect differences between patients and controls • Ibanez V, et al. Neurology 1998; 50:1585 • Bokde AL, et al. 2001;58:480 • Sakamoto S, et al. J Neuroimaging 2003; 13:113-123 • Matsuda H, et al. Eur J Nucl Med Mol Imaging 2004;29:1502 IBB, 2004
Smoothing • Voxel-based analysis, in its most diffuse implementations, involves smoothing of the images • Inherent to the warping step, performed to adapt the study to a standard normalized space (e.g. “normalization” step in SPM) • Added to reduce noise and to guarantee that residuals have a normal distribution, to apply statistical tests IBB, 2004
Smoothing • Typically, the analysis of uncorrected PET / SPET data will highlight regions in which the overall tracer content is decreased, as a consequence of either GM loss and/or reduced tracer uptake • In its simplest conception, the aim of PV-C is to detect areas with a tracer concentration lower than what we would expect based on the corresponding degree of atrophy • The local re-distribution of the activity, as a consequence of smoothing, may re-introduce a difference in areas with atrophy • (theoretically, if maximum warping is allowed during the normalization process, such that the GM of the patients is deformed to perfectly match the GM of the template, this would solve the problem) IBB, 2004
Testing • Three sets of simulated PET • 10 NV segmented MR studies brought to PET voxel size (2.03x2.03x2.43mm), with GM=255, WM=64 • Same 10 studies with -20% activity in Left Parietal • Same 10 studies with -23.7% GM in Left Parietal (using an erosion algorithm) • All studies PV-C using mMG in PVELab IBB, 2004
SPM Analysis • 4 comparisons: • Uncorrected NV vs. Hypo • Uncorrected NV vs. Atrophic • PV-corrected NV vs. Hypo • PV-corrected NV vs. Atrophic • Unpaired T-Test • No Grand-mean scaling • Threshold masking fixed (20) • Global calculation: Mean Voxel Value • W/O Non-sphericity correction • Uncorrected P<0.001 • No restriction to voxel size IBB, 2004
Original -20% -31% GM IBB, 2004
Preliminary results • In simulated atrophy, smoothing partly re-introduces PVE • Reduction in cluster size when applying PVC to simulated hypometabolism will result mainly from zeroing of non-brain voxels in PVC images (increased noise in PVC images may also play a role) • Alternative analysis techniques should be exploited • Group X Modality Interaction (Richardson MP,et al. Brain (1997), 120, 1961–1973) • Voxel-based analysis of uncorrected data definition of VOI confirmation of hypometabolism with VOI-based PVC IBB, 2004