Download

1 / 38
400 likes | 454 Vues
Learn about stress and strain, elastic and plastic behavior, toughness, ductility, and more in materials engineering. Understand Hooke's Law, elastic modulus, Poisson's ratio, and stress-strain testing.

E N D
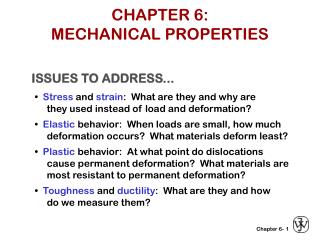
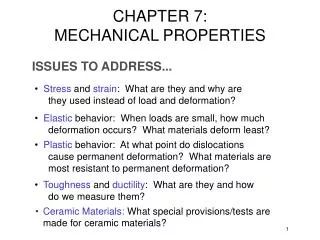
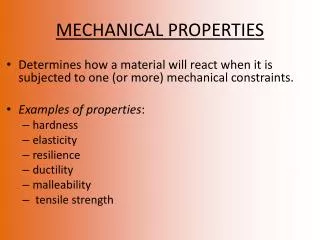
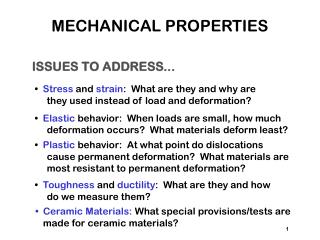
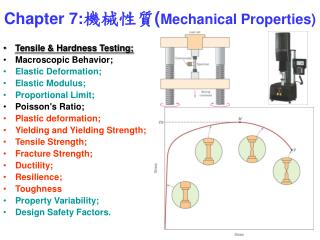
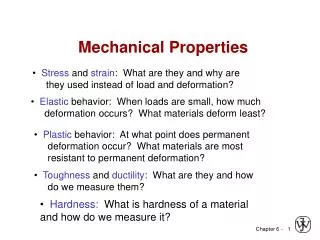
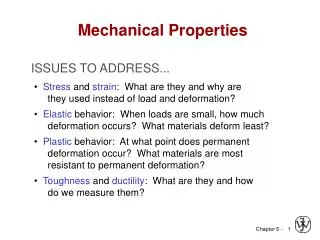
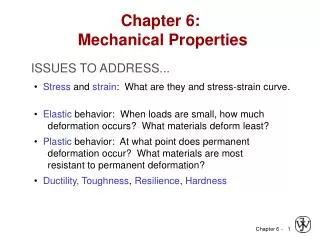
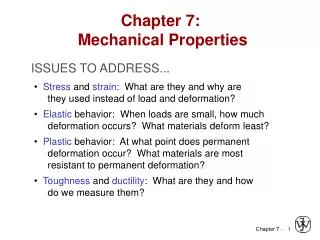
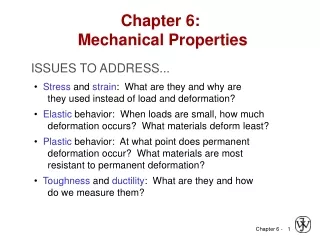
Chapter 7: Mechanical Properties ISSUES TO ADDRESS... • Stress and strain: What are they and why are they used instead of load and deformation? • Elastic behavior: When loads are small, how much deformation occurs? What materials deform least? • Plastic behavior: At what point does permanent deformation occur? What materials are most resistant to permanent deformation? • Toughness and ductility: What are they and how do we measure them?
Elastic Deformation 1. Initial 2. Small load 3. Unload bonds stretch return to initial d F F Linear- elastic Elastic means reversible! Non-Linear- elastic d
Plastic Deformation (Metals) 1. Initial 2. Small load 3. Unload bonds planes stretch still & planes sheared shear d plastic d elastic + plastic F F linear linear elastic elastic d d plastic Plastic means permanent!
Engineering Stress • Tensile stress, s: • Shear stress, t: F F F t t Area, Ao F s Area, Ao F s F t F F t s F t = F lb N t s = A = f or o 2 2 in m A o original area before loading Stress has units: N/m2 or lbf/in2
Common States of Stress F F A = cross sectional o area (when unloaded) F = s s s A o M F s A o A c F s = t A o M 2R • Simple tension: cable Ski lift(photo courtesy P.M. Anderson) • Torsion (a form of shear): drive shaft Note: t = M/AcR here.
OTHER COMMON STRESS STATES (i) A o Canyon Bridge, Los Alamos, NM (photo courtesy P.M. Anderson) F = s Balanced Rock, Arches A National Park o • Simple compression: Note: compressive structure member (s < 0 here). (photo courtesy P.M. Anderson)
OTHER COMMON STRESS STATES (ii) Fish under water s > 0 q s< 0 s > 0 z h • Bi-axial tension: • Hydrostatic compression: Pressurized tank (photo courtesy P.M. Anderson) (photo courtesy P.M. Anderson)
Engineering Strain d /2 - d d L e = e = L L w L o w o o o d /2 L • Shear strain: q g = Dx/y= tan x q y 90º - q 90º • Tensile strain: • Lateral strain: Strain is always dimensionless. Adapted from Fig. 7.1 (a) and (c), Callister & Rethwisch 3e.
• Typical tensile specimen Adapted from Fig. 7.2, Callister & Rethwisch 3e. specimen extensometer gauge length Stress-Strain Testing • Typical tensile test machine Adapted from Fig. 7.3, Callister & Rethwisch 3e. (Fig. 7.3 is taken from H.W. Hayden, W.G. Moffatt, and J. Wulff, The Structure and Properties of Materials, Vol. III, Mechanical Behavior, p. 2, John Wiley and Sons, New York, 1965.)
F • Hooke's Law: s = Ee s E F e simple Linear- tension test elastic Linear Elastic Properties • Modulus of Elasticity, E: (also known as Young's modulus)
eL e L n = - e e -n Poisson's ratio, n • Poisson's ratio, n: metals: n ~ 0.33ceramics: n~ 0.25polymers: n ~ 0.40 Units: E: [GPa] or [psi] n: dimensionless • > 0.50 density increases • < 0.50 density decreases (voids form)
Mechanical Properties • Slope of stress strain plot (which is proportional to the elastic modulus) depends on bond strength of metal Adapted from Fig. 7.7, Callister & Rethwisch 3e.
Other Elastic Properties M t G simple torsion test g M P • Elastic Bulk modulus, K: P P P D V D V P = - K V o V pressure test: Init. vol =Vo. Vol chg. = DV K o • Special relations for isotropic materials: E E = = K G 3(1-2n) 2(1+n) • Elastic Shear modulus, G: t = Gg
Young’s Moduli: Comparison 1200 10 00 Diamond 8 00 6 00 Si carbide 4 00 Tungsten Carbon fibers only Al oxide Molybdenum Si nitride Steel, Ni C FRE(|| fibers)* 2 00 Tantalum <111> Si crystal Platinum A ramid fibers only Cu alloys <100> 10 0 Zinc, Ti 8 0 Silver, Gold A FRE(|| fibers)* Glass - soda Aluminum 6 0 Glass fibers only Magnesium, G FRE(|| fibers)* 4 0 Tin Concrete GFRE* 2 0 CFRE * G FRE( fibers)* G raphite 10 8 C FRE( fibers) * 6 AFRE( fibers) * Polyester 4 PET PS Epoxy only PC 2 PP HDP E 1 0.8 0.6 Wood( grain) PTF E 0.4 LDPE 0.2 Graphite Ceramics Semicond Metals Alloys Composites /fibers Polymers E(GPa) Based on data in Table B.2, Callister & Rethwisch 3e. Composite data based on reinforced epoxy with 60 vol% of aligned carbon (CFRE), aramid (AFRE), or glass (GFRE) fibers. 109 Pa
Useful Linear Elastic Relationships • Simple torsion: 2 ML FL Fw o d = d = - n a = o o L 4 r G E A E A o o o F M = moment a = angle of twist d /2 A o d /2 L Lo Lo w o 2ro • Simple tension: • Material, geometric, and loading parameters all contribute to deflection. • Larger elastic moduli minimize elastic deflection.
Plastic (Permanent) Deformation Elastic+Plastic at larger stress permanent (plastic) after load is removed ep plastic strain (at lower temperatures, i.e. T < Tmelt/3) • Simple tension test: engineering stress, s Elastic initially engineering strain, e Adapted from Fig. 7.10 (a), Callister & Rethwisch 3e.
Yield Strength, sy s tensile stress, sy e engineering strain, e = 0.002 p • Stress at which noticeableplastic deformation has occurred. when ep = 0.002 y = yield strength Note: for 2 inch sample = 0.002 = z/z z = 0.004 in Adapted from Fig. 7.10 (a), Callister & Rethwisch 3e.
Yield Strength : Comparison Graphite/ Metals/ Composites/ Ceramics/ Polymers Alloys fibers Semicond 2000 qt Steel (4140) 1000 a Ti (5Al-2.5Sn) W (pure) 700 (MPa) 600 cw Cu (71500) 500 Mo (pure) a Steel 400 (4140) cd y Steel (1020) s 300 , ag Al (6061) hr Steel 200 (1020) ¨ a Ti (pure) Ta (pure) Hard to measure, hr Cu (71500) Hard to measure in tension, fracture usually occurs before yield. in ceramic matrix and epoxy matrix composites, since since in tension, fracture usually occurs before yield. 100 dry Yield strength, 70 PC 60 Nylon 6,6 a Al (6061) 50 PET humid PVC 40 PP 30 H DPE 20 LDPE Tin (pure) 10 Room temperature values Based on data in Table B.4, Callister & Rethwisch 3e. a = annealed hr = hot rolled ag = aged cd = cold drawn cw = cold worked qt = quenched & tempered
TS F = fracture or ultimate strength Neck – acts as stress concentrator y stress engineering Typical response of a metal strain engineering strain Tensile Strength, TS • Maximum stress on engineering stress-strain curve. Adapted from Fig. 7.11, Callister & Rethwisch 3e. • Metals: occurs when noticeable necking starts. • Polymers: occurs when polymer backbonechains are aligned and about to break.
Graphite/ Metals/ Composites/ Ceramics/ Polymers Alloys fibers Semicond 5000 C fibers Aramid fib 3000 E-glass fib 2000 qt Steel (4140) (MPa) A FRE (|| fiber) 1000 Diamond W (pure) GFRE (|| fiber) a Ti (5Al-2.5Sn) C FRE (|| fiber) a Steel (4140) cw Si nitride Cu (71500) hr Cu (71500) Al oxide Steel (1020) 300 ag Al (6061) a Ti (pure) 200 Ta (pure) a Al (6061) Si crystal wood(|| fiber) 100 <100> strength, TS Nylon 6,6 Glass-soda PET PC PVC GFRE ( fiber) 40 Concrete PP C FRE ( fiber) 30 A FRE( fiber) H DPE Graphite 20 L DPE 10 Tensile wood ( fiber) 1 Tensile Strength: Comparison Room temperature values Based on data in Table B4, Callister & Rethwisch 3e. a = annealed hr = hot rolled ag = aged cd = cold drawn cw = cold worked qt = quenched & tempered AFRE, GFRE, & CFRE = aramid, glass, & carbon fiber-reinforced epoxy composites, with 60 vol% fibers.
Ductility - L L = x 100 f o % EL L o smaller %EL E ngineering Ao tensile Lo Af Lf stress, s larger %EL Adapted from Fig. 7.13, Callister & Rethwisch 3e. Engineering tensile strain, e - A A • Another ductility measure: = o f % RA x 100 A o • Plastic tensile strain at failure:
Toughness small toughness (ceramics) E ngineering tensile large toughness (metals) stress, s very small toughness (unreinforced polymers) Engineering tensile strain, e • Energy to break a unit volume of material • Approximate by the area under the stress-strain curve. Adapted from Fig. 7.13, Callister & Rethwisch 3e. Brittle fracture: elastic energyDuctile fracture: elastic + plastic energy
1 @ s e U r y y 2 Resilience, Ur • Ability of a material to store energy • Energy stored best in elastic region If we assume a linear stress-strain curve this simplifies to Adapted from Fig. 7.15, Callister & Rethwisch 3e.
Elastic strain recovery Elastic Strain Recovery D syi syo 2. Unload Stress 3. Reapply load 1. Load Strain Adapted from Fig. 7.17, Callister & Rethwisch 3e.
Mechanical Properties Ceramic materials are more brittle than metals. Why is this so? • Consider mechanism of deformation • In crystalline, by dislocation motion • In highly ionic solids, dislocation motion is difficult • few slip systems • resistance to motion of ions of like charge (e.g., anions) past one another
Flexural Tests – Measurement of Elastic Modulus F cross section L/2 L/2 d R b d = midpoint rect. circ. deflection • Determine elastic modulus according to: F (rect. cross section) x F slope = d (circ. cross section) d linear-elastic behavior • Room T behavior is usually elastic, with brittle failure. • 3-Point Bend Testing often used. -- tensile tests are difficult for brittle materials. Adapted from Fig. 7.18, Callister & Rethwisch 3e.
Flexural Tests – Measurement of Flexural Strength F cross section L/2 L/2 d R b location of max tension d = midpoint rect. circ. deflection • Typical values: • Flexural strength: s Material (MPa) E(GPa) fs Si nitride Si carbide Al oxide glass (soda-lime) 250-1000 100-820 275-700 69 304 345 393 69 (rect. cross section) (circ. cross section) Data from Table 7.2, Callister & Rethwisch 3e. • 3-point bend test to measure room-T flexural strength. Adapted from Fig. 7.18, Callister & Rethwisch 3e.
Mechanical Properties of Polymers – Stress-Strain Behavior brittle polymer plastic elastomer elastic moduli – less than for metals Adapted from Fig. 7.22, Callister & Rethwisch 3e. • Fracture strengths of polymers ~ 10% of those for metals • Deformation strains for polymers > 1000% –for most metals, deformation strains < 10% 28
Influence of T and Strain Rate on Thermoplastics 8 0 6 0 4 0 20 s (MPa) • Decreasing T... -- increases E -- increases TS -- decreases %EL • Increasing strain rate... -- same effects as decreasing T. Plots for 4°C semicrystalline PMMA (Plexiglas) 20°C 40°C to 1.3 60°C 0 e 0 0.1 0.2 0.3 Adapted from Fig. 7.24, Callister & Rethwisch 3e. (Fig. 7.24 is from T.S. Carswell and J.K. Nason, 'Effect of Environmental Conditions on the Mechanical Properties of Organic Plastics", Symposium on Plastics, American Society for Testing and Materials, Philadelphia, PA, 1944.) 29
Time-Dependent Deformation • There is a large decrease in Er for T > Tg. (amorphous polystyrene) 5 10 rigid solid Er(10 s) (small relax) Adapted from Fig. 7.28, Callister & Rethwisch 3e. (Fig. 7.28 is from A.V. Tobolsky, Properties and Structures of Polymers, John Wiley and Sons, Inc., 1960.) 3 10 in MPa transition tensile test 1 10 region eo strain -1 10 viscous liquid -3 s(t) (large relax) 10 60 100 140 180 T(°C) time Tg • Representative Tg values (C): • Relaxation modulus: PE (low density) PE (high density) PVC PS PC -110 - 90 + 87 +100 +150 Selected values from Table 11.3, Callister & Rethwisch 3e. • Stress relaxation test: -- strain in tension to eo and hold. -- observe decrease in stress with time. 30
apply known force measure size e.g., of indent after 10 mm sphere removing load Smaller indents d D mean larger hardness. most brasses easy to machine cutting nitrided plastics Al alloys steels file hard tools steels diamond increasing hardness Hardness • Resistance to permanently indenting the surface. • Large hardness means: -- resistance to plastic deformation or cracking in compression. -- better wear properties.
Hardness: Measurement • Rockwell • No major sample damage • Each scale runs to 130 but only useful in range 20-100. • Minor load 10 kg • Major load 60 (A), 100 (B) & 150 (C) kg • A = diamond, B = 1/16 in. ball, C = diamond • HB = Brinell Hardness • TS (psia) = 500 x HB • TS (MPa) = 3.45 x HB
Hardness: Measurement Table 7.5
True Stress & Strain Note: S.A. changes when sample stretched • True stress • True strain Adapted from Fig. 7.16, Callister & Rethwisch 3e.
s y 1 s y 0 hardening exponent: ( ) n n = 0.15 (some steels) s = e K T T to n = 0.5 (some coppers) “true” strain: ln(L/Lo) “true” stress (F/A) Hardening • An increase in sy due to plastic deformation. s large hardening small hardening e • Curve fit to the stress-strain response:
Variability in Material Properties • Elastic modulus is material property • Critical properties depend largely on sample flaws (defects, etc.). Large sample to sample variability. • Statistics • Mean • Standard Deviation where n is the number of data points
Design or Safety Factors d 1045 plain carbon steel: L o s = 310 MPa y 5 TS = 565 MPa F = 220,000N • Design uncertainties mean we do not push the limit. • Factor of safety, N Often N is between 1.2 and 4 • Example: Calculate a diameter, d, to ensure that yield does not occur in the 1045 carbon steel rod below. Use a factor of safety of 5. d = 0.067 m = 6.7 cm
Summary • Stress and strain: These are size-independent measures of load and displacement, respectively. • Elastic behavior: This reversible behavior often shows a linear relation between stress and strain. To minimize deformation, select a material with a large elastic modulus (E or G). • Plastic behavior: This permanent deformation behavior occurs when the tensile (or compressive) uniaxial stress reaches sy. • Toughness: The energy needed to break a unit volume of material. • Ductility: The plastic strain at failure.