Chapter 7: Mechanical Properties
Chapter 7: Mechanical Properties. Why mechanical properties?. • Need to design materials that will withstand applied load and in-service uses for…. Bridges for autos and people. MEMS devices. skyscrapers. Space elevator?. Space exploration. Chapter 7: Mechanical Properties.


Chapter 7: Mechanical Properties
E N D
Presentation Transcript
Chapter 7: Mechanical Properties Why mechanical properties? • Need to design materials that will withstand applied load and in-service uses for… Bridges for autos and people MEMS devices skyscrapers Space elevator? Space exploration
Chapter 7: Mechanical Properties ISSUES TO ADDRESS... • Stress and strain: Normalized force and displacements. • Elastic behavior: When loads are small. • Plastic behavior: dislocations and permanent deformation • • Toughness, ductility, resilience, toughness, and hardness: • Define and how do we measure? • Mechanical behavior of the various classes of materials.
Stress and Strain Stress: Force per unit area arising from applied load. Tension, compression, shear, torsion or any combination. Stress = σ = force/area Strain: ε – physical deformation response of a material to stress, e.g., elongation.
Engineering Stress • Tensile stress, s: • Shear stress, t: Stress has units: N/m2 (or lb/in2 )
Pure Tension Pure Compression stress strain Elastic response Pure Shear stress strain Elastic response Pure Torsional Shear
Common States of Stress • Simple tension: cable Ski lift(photo courtesy P.M. Anderson) • Simple shear: drive shaft Note: t = M/AcR here.
Common States of Stress • Simple compression: (photo courtesy P.M. Anderson) Note: compressive structural member (σ < 0). (photo courtesy P.M. Anderson)
Common States of Stress • Bi-axial tension: • Hydrostatic compression: Pressurized tank (photo courtesy P.M. Anderson) (photo courtesy P.M. Anderson) σ< 0 h
Engineering Strain • Tensile strain: • Lateral (width) strain: • Shear strain: Strain is always dimensionless.
Elastic Deformation F d 1. Initial 2. Small load 3. Unload bonds stretch return to initial d F Linear- elastic Elastic means reversible! Non-Linear- elastic
Plastic Deformation of Metals 1. Initial 2. Small load 3. Unload bonds planes stretch still & planes sheared shear δ plastic δ elastic + plastic F F linear linear elastic elastic d εelastic δ plastic Plastic means permanent!
specimen extensometer gauge length Strain Testing • Tensile test machine • Tensile specimen Often 12.8 mm x 60 mm Adapted from Fig. 7.2, Callister & Rethwisch 3e. • Other types: -compression: brittle materials (e.g., concrete) -torsion: cylindrical tubes, shafts.
s E Axial strain e Linear- elastic Width strain Linear Elasticity Units: E [GPa] or [psi] • Modulus of Elasticity, E: (also known as Young's modulus) • Hooke's Law: σ = E ε
Axial strain Width strain Example: Hooke’s Law • Hooke's Law: σ = E ε (linear elastic behavior) Copper sample (305 mm long) is pulled in tension with stress of 276 MPa. If deformation is elastic, what is elongation? For Cu (polycrystalline), E = 110 GPa. Hooke’s law involves axial (parallel to applied tensile load) elastic deformation.
Elastic Deformation F d 1. Initial 2. Small load 3. Unload bonds stretch return to initial d F Linear- elastic Elastic means reversible! Non-Linear- elastic
Mechanical Properties • Recall: Bonding Energy vs distance plots tension compression Adapted from Fig. 2.8 Callister & Rethwisch 3e.
Mechanical Properties • Recall: Slope of stress strain plot (proportional to the E) depends on bond strength of metal E larger E smaller Adapted from Fig. 7.7, Callister & Rethwisch 3e.
Al2O3 Elasticity of Ceramics And Effects of Porosity E= E0(1 - 1.9P + 0.9 P2) • Elastic Behavior Neither Glass or Alumina experience plastic deformation before fracture!
Comparison of Elastic Moduli Silicon (single xtal) 120-190 (depends on crystallographic direction) Glass (pyrex) 70 SiC (fused or sintered) 207-483 Graphite (molded) ~12 High modulus C-fiber 400 Carbon Nanotubes ~1000 Normalize by density, 20x steel wire. strength normalized by density is 56x wire.
Polymers: Tangent and Secant Modulus • • Tangent Modulus is experienced in service. • Secant Modulus is effective modulus at 2% strain. • - grey cast iron is also an example • Modulus of polymer changes with time and strain-rate. • - must report strain-rate dε/dt for polymers. • - must report fracture strain εfbefore fracture. initial E Stress (MPa) secant E tangent E %strain 1 2 3 4 5 …..
Young’s Modulus, E Graphite Ceramics Semicond Metals Alloys Composites /fibers Polymers E(GPa) Based on data in Table B2, Callister 6e. Composite data based on reinforced epoxy with 60 vol% of aligned carbon (CFRE), aramid (AFRE), or glass (GFRE) fibers.
eL e -ν Axial strain Width strain Poisson's ratio, • Poisson's ratio, ν: Units: n dimensionless metals: ν ~ 0.33ceramics: ν~ 0.25polymers: ν ~ 0.40 Why does ν have minus sign?
Limits of the Poisson Ratio • • Poisson Ratio has a range –1 ≤ν ≤ 1/2 • Look at extremes • No change in aspect ratio: • Volume (V = AL) remains constant: ΔV =0. • Hence, ΔV = (L ΔA+A ΔL) = 0. So, • In terms of width, A = w2, then ΔA/A = 2 w Δw/w2 = 2Δw/w = –ΔL/L. • Hence, Incompressible solid. Water (almost).
Poisson Ratio: materials specific Metals: Ir W Ni Cu Al Ag Au 0.26 0.29 0.31 0.34 0.34 0.38 0.42 generic value ~ 1/3 Solid Argon: 0.25 Covalent Solids: Si Ge Al2O3 TiC 0.27 0.28 0.23 0.19 generic value ~ 1/4 Ionic Solids: MgO 0.19 Silica Glass: 0.20 Polymers: Network (Bakelite) 0.49 Chain (PE) 0.40 ~generic value Elastomer: Hard Rubber (Ebonite) 0.39 (Natural) 0.49
Example: Poisson Effect • Tensile stress is applied along cylindrical brass rod (10 mm diameter). Poisson ratio is ν = 0.34 and E = 97 GPa. • Determine load needed for 2.5x10⁻³ mm change in diameter if the deformation is entirely elastic? Width strain: (note reduction in diameter) εx= Δd/d = –(2.5x10⁻³ mm)/(10 mm) = –2.5x10⁻⁴ Axial strain: Given Poissonratio εz= –εx/ν = –(–2.5x10⁻⁴)/0.34 = +7.35x10⁻⁴ Axial Stress: σz = Eεz = (97x103 MPa)(7.35x10⁻⁴) = 71.3 MPa. Required Load:F = σzA0 = (71.3 MPa) π(5 mm)2 = 5600 N.
Other Elastic Properties • Elastic Shear modulus, G: simple Torsion test τ = Gγ • Elastic Bulk modulus, K: Pressure test: Init. vol = Vo. Vol chg. = ΔV • Special relations for isotropic materials: So, only 2 independent elastic constants for isotropic media
• Simple torsion: 2 ML FL o d = a = o Fw = - ν d o 4 πr w G E A o o E A o F M = moment a = angle of twist d /2 A o d /2 w Lo Lo w o 2ro Useful Linear Elastic Relationships • Simple tension: • Material, geometric, and loading parameters all contribute to deflection. • Larger elastic moduli minimize elastic deflection.
Poisson σ3 , ε3 Complex States of Stress in 3D • There are 3 principal componentsof stress and (small) strain. • For linear elastic, isotropic case, use“linear superposition”. • Strain || to load byHooke’s Law: εi=σi/E, i=1,2,3 (maybe x,y,z). • Strain εto load governed byPoisson effect: εwidth = –νεaxial. Total Strain in x in y in z In x-direction, total linear strain is:
Complex State of Stress and Strain in 3-D Solid • Hooke’s Lawand Poisson effect gives total linear strain: • For uniaxial tension testσ1= σ2 =0, so ε3= σ3/E and ε1=ε2= –νε3. • Hydrostatic Pressure: • For volume (V=l1l2l3) strain, ΔV/V = ε1+ ε2+ ε3 = (1-2ν)σ3/E Bulk Modulus, B or K: P = –K ΔV/V so K = E/3(1-2ν) (sec. 7.5)
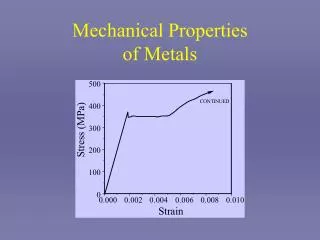
Elastic+Plastic at larger stress permanent (plastic) after load is removed ep plastic strain Plastic (Permanent) Deformation (at lower temperatures, i.e. T < Tmelt/3) • Simple tension test: engineering stress, s Elastic initially engineering strain, e Adapted from Fig. 7.10 (a), Callister & Rethwisch 3e.
σ tensile stress, P Elastic recovery Eng. strain, ε ε = 0.002 p Yield Stress, σY • Stress where noticeableplastic deformation occurs. When εp = 0.002 For metals agreed upon 0.2% • P is the proportional limit where deviation from linear behavior occurs. σY • Strain off-set method for Yield Stress • Start at 0.2% strain (for most metals). • Draw line parallel to elastic curve (slope of E). • σY is value of stress where dotted line crosses stress-strain curve (dashed line). Note: for 2 in. sample ε = 0.002 = Δz/z Δz = 0.004 in
For steels, take the avg. stress of lower yield point since less sensitive to testing methods. Yield Points and σYS • Yield-point phenomenon occurs when elastic plastic transition is abrupt. No offset method required. • In steels, this effect is seen when dislocations start to move and unbind for interstitial solute. • Lower yield point taken as σY. • Jagged curve at lower yield point occurs when solute binds dislocation and dislocation unbinding again, until work-hardening begins to occur.
Stress-Strain in Polymers • 3 different types of behavior • For plastic polymers: • YS at maximum stress just after elastic region. • TS is stress at fracture! Brittle plastic Highly elastic • Highly elastic polymers: • Elongate to as much as 1000% (e.g. silly putty). • 7 MPa < E < 4 GPa 3 order of magnitude! • TS(max) ~ 100 MPa some metal alloys up to 4 GPa
Compare Yield Stress, σYS Room T values Based on data in Table B4, Callister 6e. a = annealed hr = hot rolled ag = aged cd = cold drawn cw = cold worked qt = quenched & tempered
TS F = fracture or ultimate strength Neck – acts as stress concentrator y stress engineering Typical response of a metal strain engineering strain (Ultimate) Tensile Strength, σTS • Maximum possible engineering stress in tension. • Metals: occurs when necking starts. • Ceramics: occurs when crack propagation starts. • Polymers: occurs when polymer backbones are aligned and about to break.
Metals: Tensile Strength, vTS For Metals: max. stress in tension when necking starts, which is the metals work-hardening tendencies vis-à-vis those that initiate instabilities. Maximum eng. Stress (at necking) fractional decrease in load-bearing area Fractional Increase in Flow stress decreased force due to decrease in gage diameter Increased force due to increase in applied stress At the point where these two competing changes in force equal, there is permanent neck. Determined by slope of “true stress” - “true strain” curve
Graphite/ Metals/ Composites/ Ceramics/ Polymers Alloys fibers Semicond 5000 C fibers Aramid fib 3000 E-glass fib 2000 qt Steel (4140) (MPa) A FRE (|| fiber) 1000 Diamond W (pure) GFRE (|| fiber) a Ti (5Al-2.5Sn) C FRE (|| fiber) a Steel (4140) cw Si nitride Cu (71500) hr Cu (71500) Al oxide Steel (1020) 300 ag Al (6061) a Ti (pure) 200 Ta (pure) a Al (6061) Si crystal wood(|| fiber) 100 strength, TS <100> Nylon 6,6 Glass-soda PET PC PVC GFRE ( fiber) 40 Concrete PP C FRE ( fiber) 30 A FRE( fiber) H DPE Graphite 20 L DPE 10 Tensile wood ( fiber) 1 Compare Tensile Strength, σTS Room T values Based on data in Table B4, Callister & Rethwisch 3e.
Δl = εl0 = (0.06)250 mm = 15 mm Example for Metals: Determine E, YS, and TS Stress-Strain for Brass • Young’s Modulus, E (bond stretch) • 0ffset Yield-Stress, YS (plastic deformation) • Max. Load from Tensile Strength TS • Gage is 250 mm (10 in) in length and 12.8 mm (0.505 in) in diameter. • Subject to tensile stress of 345 MPa (50 ksi) • Change in length at Point A, Δl = εl0
Temperature matters (see Failure) Most metals are ductile at RT and above, but can become brittle at low T bcc Fe cup-and-cone fracture in Al brittle fracture in mild steel
Ductility (%EL and %RA) • Plastic tensile strain at failure: Adapted from Fig. 7.13, Callister & Rethwisch 3e. • Another ductility measure: • Note: %RA and %EL are often comparable. - Reason: crystal slip does not change material volume. - %RA > %EL possible if internal voids form in neck.
small toughness (ceramics) E ngineering tensile large toughness (metals) stress, σ very small toughness (unreinforced polymers) Engineering tensile strain, ε Toughness • Energy to break a unit volume of material, or absorb energy to fracture. • Approximate as area under the stress-strain curve. Brittle fracture: elastic energyDuctile fracture: elastic + plastic energy
Resilience, Ur • Resilience is capacity to absorb energy when deformed elastically and recover all energy when unloaded (=σ2YS/2E). • Approximate as area under the elastic stress-strain curve. Area up to 0.2% strain If linear elastic
D 2. Unload Stress 3. Reapply load 1. Load Strain Elastic strain recovery Adapted from Fig. 7.17, Callister & Rethwisch 3e. Elastic Strain Recovery • • Unloading in step 2 allows elastic strain to be recovered from bonds. • Reloading leads to higher YS, due to work-hardening already done. syi syo
Ceramics Mechanical Properties • Ceramic materials are more brittle than metals. Why? • Consider mechanism of deformation • In crystalline materials, by dislocation motion • In highly ionic solids, dislocation motion is difficult • due to too few slip systems • Not {111}<110> as in fcc metal! • Why is it {110}<110> (or{100} <110> )? • resistance to motion of ions of • like charge (e.g., anions) • past one another.
cross section d R d = midpoint b deflection rect. circ. • Determine elastic modulus according to: F (rect. cross section) x F slope = d (circ. cross section) d linear-elastic behavior Strength of Ceramics - Elastic Modulus • • RT behavior is usually elastic with brittle failure. • 3-point bend test employed (tensile test not best for brittle materials).
Al2O3 s Material (MPa) E(GPa) d fs Si nitride Si carbide Al oxide glass (soda-lime) 250-1000 100-820 275-700 69 304 345 393 69 b R Strength of Ceramics - Flexural Strength • 3-point bend test employed for RT Flexural strength. Rectangular cross-section • Typical values: Circular cross-section L= length between load pts b = width d = height or diameter Data from Table 7.2, Callister & Rethwisch 3e.
brittle polymer plastic elastomer elastic moduli – less than for metals Adapted from Fig. 7.22, Callister & Rethwisch 3e. Stress-Strain in Polymers • Fracture strengths of polymers ~ 10% of those for metals. • Deformation strains for polymers > 1000%.–for most metals, deformation strains < 10%.
8 0 6 0 4 0 20 Influence of T and Strain Rate on Thermoplastics s (MPa) • Decreasing T... -- increases E -- increases TS -- decreases %EL • Increasing strain rate... -- same effects as decreasing T. Plots for 4°C semicrystalline PMMA (Plexiglas) 20°C 40°C to 1.3 60°C 0 e 0 0.1 0.2 0.3 Adapted from Fig. 7.24, Callister & Rethwisch 3e. (Fig. 7.24 is from T.S. Carswell and J.K. Nason, 'Effect of Environmental Conditions on the Mechanical Properties of Organic Plastics", Symposium on Plastics, American Society for Testing and Materials, Philadelphia, PA, 1944.)
Stress-Strain in Polymers • Necking appears along entire sample after YS! • Mechanism unlike metals, necking due to alignment of crystallites. Load vertical • Align crystalline sections by straightening chains in the amorphous sections • After YS, necking proceeds by unraveling; hence, neck propagates, unlike in metals! See Chpt 8
• Large decrease in Er for T > Tg. (amorphous polystyrene) 5 10 rigid solid Er(10 s) (small relax) Fig. 7.28, Callister & Rethwisch 3e. (Fig. 7.28 from A.V. Tobolsky, Properties and Structures of Polymers, Wiley and Sons, Inc., 1960.) 3 10 in MPa transition tensile test 1 10 region eo strain -1 10 viscous liquid -3 s(t) (large relax) 10 60 100 140 180 T(°C) time Tg • Representative Tg values (in C): • Relaxation modulus: PE (low density) PE (high density) PVC PS PC -110 - 90 + 87 +100 +150 Selected values from Table 11.3, Callister & Rethwisch 3e. Time-dependent deformation in Polymers • Stress relaxation test: • strain in tension to eo • and hold. • - observe decrease in • stress with time.