Download
1 / 20
200 likes | 361 Vues
Calibration and Validation of Multi-Satellite scatterometer winds. A. Bentamy 1 , S. A. Grodsky 2 , D.C. Fillon 1 , J.F. Piollé 1 (1) Laboratoire d’Océanographie Spatiale / IFREMER (2) Univ. Of Maryland. Topics

E N D
IOVWST Meeting 9 - 11 May 2011 Maryland Calibration and Validation of Multi-Satellite scatterometer winds A. Bentamy 1, S. A. Grodsky2, D.C. Fillon1, J.F. Piollé1 (1) Laboratoire d’Océanographie Spatiale / IFREMER (2) Univ. Of Maryland Topics • Estimation of homogeneous long time series of surface wind vector over global ocean • Processing, combining, analyzing, and validating data from ERS-1, ERS-2, NSCAT, QuikSCAT, and ASCAT • Assessement of surface wind comparisons between various scatterometer retrievals at various scales • Caracterisation of the differences • Empirical bias correction
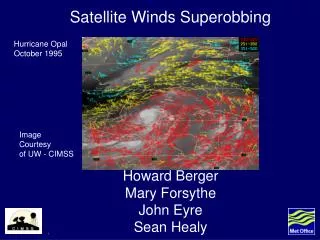
IOVWST Meeting 9 - 11 May 2011 Maryland Example of Long Time Series from Multiu-Satellite Observations (Bentamy et al, 2009) • Time series of statistical parameters of NDBC buoy and blended wind speed differences: a) bias(m/s); b) Std(m/s); c) regression slope coefficient; d) correlation coefficient; e) sampling length ERS-1 / ERS-2 ERS-2 / NSCAT ERS-2 ERS-2 / QuikSCAT QuikSCAT
IOVWST Meeting 9 - 11 May 2011 Maryland ASCAT / QuikSCAT • Previous Comparison results (Bentamy et al, 2008): Period : April – November 2007 / ASCAT: Actual winds • Present Study : April 2007 – November 2009 • Focus : November 2008 – November 2009 QuikSCAT • Data Source: PODAAC / JPL • Products: L1b & L2b 25 • GMF : QSCAT-1/F13 • Wind retrieval: Selected solution • Data selection: • All WVC • Wind Speed : 0 – 50m/s • Wind direction : 0° – 360° • Quality flags: ASCAT • Data Source: OSI SAF / KNMI • Products: L1b & L2b 25 • GMF : CMOD5 and CMOD5n • Wind retrieval: Selected solution • Data selection: • All WVC • Wind Speed : 0 – 50m/s • Wind direction : 0° – 360° • Quality flags
IOVWST Meeting 9 - 11 May 2011 Maryland Ancillary Data • Buoy • NDBC (hourly / Pacific and Atlantic) • MFUK (hourly / Atlantic and Mediterranean) • TAO (10mn-Hourly / Pacific) • PIRATA (10mn-Hourly / Atlantic) • RAMA (10mn-Hourly / Indian) • Buoy U10N Calculation: Tang et al (1996) • Numerical Model • ECMWF Analyses (6-hourly/0.5°) • QuikSCAT l2b products • RSS • KNMI 4
IOVWST Meeting 9 - 11 May 2011 Maryland Collocation Matchup Data • For Each QSCAT swath all ASCAT WVC occurring within 4 hours and 50km of QSCAT data are selected • Only the closest, in space and time, collocated data are used • Only valid retrievals are selected with respect to ASCAT and QuikSCAT Quality flags. • QuikSCAT rain flagging: • Only QSCAT WVC wind data such as both IMUDH algorithm and rain detection are valid, are selected • Mp_rain-probability values are selected for further investigations. Sampling length of Collocated data as function of time separation and latitudes
IOVWST Meeting 9 - 11 May 2011 Maryland Error Sources • Temporal Separation Impact • Statistics of differences between buoy wind speeds Wbq – Wba • Wbq and Wba are buoy data collocated with QSCAT and ASCAT, respectively. • No systematic bias is found Mean differences are lower than 0.30m/s for 95% of buoys
IOVWST Meeting 9 - 11 May 2011 Maryland Error Sources • Using ECMWF analysis • 6-hourly Estimates are interpolated in time and space over ASCCAT and QuikSCAT Swaths • Simulated data are spatially and temporally collocated (ASCAT / QSCAT procedure) Mean Difference (m/s) Std Difference (m/s) Speed Zonal Meridional
IOVWST Meeting 9 - 11 May 2011 Maryland Local Assessement fo ASCAT/QSCAT Collocated Data • Comparisons with NDBC buoy hourly measurements
IOVWST Meeting 9 - 11 May 2011 Maryland Error Analysis • Scaterometer wind speed errors as determined from triplet collocated data: buoy(NDBC and MFUK), ASCAT, and QuikSCAT during the period: April 2007 – November 2009. • Ub = bU + b; Ua = aU + a ; Uq = qU + q(e.g. Janssen et al, 2007). Distribution of time difference between collocated NDBC/ASCAT/QuikSCAT Monthly NDBC buoy, ASCAT, and QuikSCAT wind speed errors
IOVWST Meeting 9 - 11 May 2011 Maryland Global Comparisons ASCAT QuikSCAT • Mean Wind Fields from Collocated ASCAT and QuikSCAT data during November 2008 – November 2009 period. Speed Zonal Meridional
IOVWST Meeting 9 - 11 May 2011 Maryland Global Comparisons • Wind Direction Comparison • Steadyness coefficient :
IOVWST Meeting 9 - 11 May 2011 Maryland Global Comparisons Difference in time means (m/s) STD (m/s) • Bias (left) and STD (right) of wind speed (top), U (middle), and V (bottom) differences between QuikSCAT and ASCAT during November 2008 – November 2009. WSP U V
IOVWST Meeting 9 - 11 May 2011 Maryland Global Comparisons • Spatial distributions ofCorrelation coefficients Speed Zonal Meridional
IOVWST Meeting 9 - 11 May 2011 Maryland Analysis of ASCAT and QSCAT Differences • = B0 + B1cos + B2cos2 • B0 highly related to wind speed • B0 = ( u + d + 2c)/4 • Difference between ASCAT measured and estimated (Cmod5n) B0 14
IOVWST Meeting 9 - 11 May 2011 Maryland Tropical Buoy Comparisons
IOVWST Meeting 9 - 11 May 2011 Maryland Analysis of ASCAT and QSCAT Differences Wind Speed Differences: November 2008 – November 2009 • Rain Impact All QSCAT - ASCAT QSCAT Rain free (Quality flag) - ASCAT QSCAT Rain free (Quality flag+mrp threshold) - ASCAT
IOVWST Meeting 9 - 11 May 2011 Maryland Analysis of ASCAT and QSCAT Differences • Analysis is performed over Tropical area and as a function of • Wind speed ranges • Swath locations • …
IOVWST Meeting 9 - 11 May 2011 Maryland Analysis of ASCAT and QSCAT Differences QSCAT – ASCAT as a function of MRP values Wind Speed Distribtion as function of QSCAT MLE
IOVWST Meeting 9 - 11 May 2011 Maryland Analysis of ASCAT and QSCAT Differences Wind Speed Difference as a function of Wind direction relative to ASCAT mid-beam azimuth (AZIM1) QSCAT – ASCAT Buoy– ASCAT Wind Difference Wind WDIR-AZIM1 WDIR-AZIM1
IOVWST Meeting 9 - 11 May 2011 Maryland Summary • 30 months of space and time collocated wind from ASCAT and QuikSCAT have been investigated over global ocean • Winds from both scatterometers agree very well with a global bias of 0.20m/s and rms of 1.10m/s • The main bias spatial patterns are found in inter-tropical and at high latitude zones. • The main parameters founded to be associated with such differences are • Rain impact on Ku band measurements • Wind distributions along swath for both scatterometers • MLE distribution • ASCAT Wind distribution with respect to azimuth direction • For long time series calculation data selection and empirical bias correction determined from above parameters will be applied.