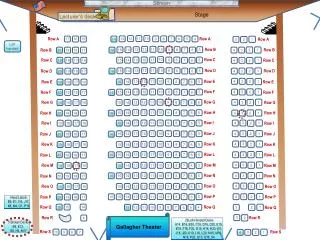
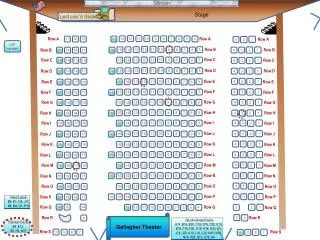
Stage
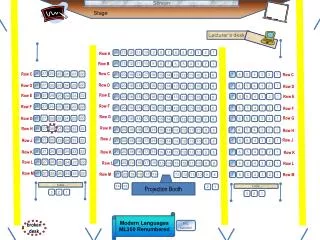
Stage. Screen. Lecturer’s desk. 12. 11. 10. 13. 9. 8. 7. 6. 5. 4. 15. 17. 14. 16. Row A. Row A. 1. 3. Row A. 2. Left handed. 12. 11. 10. 13. Row B. 9. 8. 5. 15. 14. 1. 2. 7. 6. 4. 3. Row B. 20. 19. 18. 17. 16. Row B. 10. 13. 12. 11. Row C. 9.

Stage
E N D
Presentation Transcript
Stage Screen Lecturer’s desk 12 11 10 13 9 8 7 6 5 4 15 17 14 16 Row A Row A 1 3 Row A 2 Left handed 12 11 10 13 Row B 9 8 5 15 14 1 2 7 6 4 3 Row B 20 19 18 17 16 Row B 10 13 12 11 Row C 9 8 5 15 14 1 19 18 17 16 Row C 4 3 7 6 Row C 2 13 12 11 10 Row D 9 8 5 15 14 2 1 7 6 Row D 4 3 20 19 18 17 16 Row D 10 4 3 2 1 13 12 11 Row E 9 8 5 15 14 7 6 Row E 19 18 17 16 Row E 1 2 13 12 11 10 Row F 9 8 5 4 3 15 14 7 6 20 19 18 17 Row F 16 Row F 1 13 12 11 10 Row G 4 3 9 8 5 2 15 14 19 18 17 16 Row G 7 6 Row G 13 12 11 10 Row H 9 8 5 15 14 1 2 7 6 4 3 20 19 18 17 Row H 16 Row H 1 13 12 11 10 Row I 4 3 9 8 5 2 15 14 19 18 17 16 Row I 7 6 Row I 1 2 13 12 11 10 Row J 9 8 5 4 3 15 14 7 6 20 19 18 17 Row J 16 Row J 1 4 3 2 13 12 11 10 Row K 9 8 5 15 14 19 18 17 16 Row K 7 6 Row K 7 1 2 13 12 11 10 Row L 9 8 5 20 4 3 15 14 16 6 19 18 17 Row L Row L 1 4 3 2 13 12 11 10 Row M 9 8 5 15 14 19 18 17 16 Row M 7 6 Row M 1 2 13 12 11 10 Row N 9 8 7 5 4 3 15 14 16 6 20 19 18 17 Row N Row N 4 3 2 1 13 12 11 10 Row O 9 8 5 15 14 19 18 17 16 Row O 7 6 Row O 1 2 13 12 11 10 Row P 9 8 7 5 4 3 15 14 16 6 20 19 18 17 Row P Row P Need Labels B5, E1, I16, J17, K8, M4, O1, P16 16 15 14 1 2 Row Q 13 12 11 10 Row Q 3 9 8 7 5 4 6 Row Q Gallagher Theater 3 2 Row R Row R 4 26Left-Handed Desks A14, B16, B20, C19, D16, D20, E15, E19, F16, F20, G19, H16, H20, I15, J16, J20, K19, L16, L20, M15, M19, N16, P20, Q13, Q16, S4 5 Broken Desks B9, E12, G9, H3, M17 Row S 10 1 2 9 8 7 Row S 4 3
Stage Screen Social Sciences 100 Lecturer’s desk R/L handed 16 13 17 15 14 12 Row A 26 25 24 12 11 10 27 23 22 13 Row B Row B 21 20 19 18 17 16 15 14 28 27 26 23 25 24 12 11 10 Row C 22 13 9 8 6 5 Row C 21 20 19 18 17 16 15 14 7 4 Row C 9 8 6 5 27 2 29 28 26 25 24 23 12 11 10 7 4 3 22 13 Row D Row D 30 21 20 19 18 17 16 15 14 Row D 12 11 10 5 2 1 22 13 9 8 7 6 4 3 Row E 23 21 20 19 18 17 16 15 14 31 30 29 28 27 26 25 24 Row E Row E 5 2 1 12 11 10 9 8 7 6 4 3 Row F 22 13 21 20 19 18 17 16 15 14 Row F 23 31 30 29 28 27 26 25 24 Row F Row G 23 31 30 29 28 27 26 25 24 12 11 10 22 13 Row G Row G 5 21 20 19 18 17 16 15 14 2 1 9 8 7 6 4 3 5 2 1 Row H 9 8 7 6 4 3 12 11 10 22 13 23 21 20 19 18 17 16 15 14 31 30 29 28 27 26 25 24 Row H Row H 12 11 10 5 2 1 22 13 Row I 9 8 7 6 4 3 21 20 19 18 17 16 15 14 Row I 23 31 30 29 28 27 26 25 24 Row I 5 2 1 12 11 10 9 8 7 6 4 3 Row J 22 13 21 20 19 18 17 16 15 14 Row J 23 31 30 29 28 27 26 25 24 Row J 5 2 1 9 8 7 6 4 3 Row K 12 11 10 Row K 22 13 23 21 20 19 18 17 16 15 14 31 30 29 28 27 26 25 24 Row K Row L 5 1 9 8 7 6 4 3 12 11 10 Row L 22 13 23 21 20 19 18 17 16 15 14 31 30 29 28 27 26 25 24 Row L 2 Row M 5 2 1 9 8 7 6 4 3 23 31 30 29 28 27 26 25 24 12 11 10 Row M 22 13 21 20 19 18 17 16 15 14 Row M Row N 5 2 1 12 11 10 9 8 7 6 4 3 22 13 21 20 19 18 17 16 15 14 Row N 23 31 30 29 28 27 26 25 24 Row N 5 2 1 9 8 7 6 4 3 12 11 10 Row O 23 31 30 29 28 27 26 25 24 22 13 21 20 19 18 17 16 15 14 Row O Row O 5 2 1 9 8 7 6 4 3 Row P 12 11 10 Row P 23 31 30 29 28 27 26 25 24 22 13 21 20 19 18 17 16 15 14 Row P 5 2 1 Row Q 9 8 7 6 4 3 12 11 10 Row Q 22 13 23 21 20 19 18 17 16 15 14 31 30 29 28 27 26 25 24 Row Q Row R 5 2 1 9 8 7 6 4 3 12 11 10 23 Row R 31 30 29 28 27 26 25 24 22 13 21 20 19 18 17 16 15 14 Row R table broken desk 5 2 1 9 8 7 6 4 3 Projection Booth
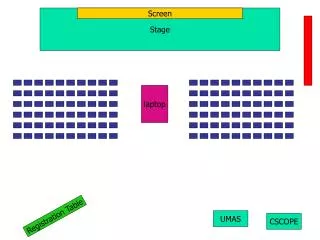
MGMT 276: Statistical Inference in ManagementFall, 2014 Welcome Green sheets
We have a guest Prof. Stephen Gilliland from the Center for Leadership Ethics
Basic Demographic Information • What is your gender? A. Female B. Male • Would you describe yourself as: A. African-American B. Asian/Asian-American C. Caucasian D. Hispanic/Latino E. Other • Is English your native language? A. Yes B. No • Your current age Please write your age on the back of your SCANTRON. For example, Question #122. 19 )
Reminder A noteon doodling Talking or whispering to your neighbor can be a problem for us – please consider writing short notes.
Schedule of readings We’ll be jumping around some…we will start with chapter 7 Before our next exam (October 21st) Lind (5 – 11) Chapter 5: Survey of Probability Concepts Chapter 6: Discrete Probability Distributions Chapter 7: Continuous Probability Distributions Chapter 8: Sampling Methods and CLT Chapter 9: Estimation and Confidence Interval Chapter 10: One sample Tests of Hypothesis Chapter 11: Two sample Tests of Hypothesis Plous (10, 11, 12 & 14) Chapter 10: The Representativeness Heuristic Chapter 11: The Availability Heuristic Chapter 12: Probability and Risk Chapter 14: The Perception of Randomness
Use this as your study guide By the end of lecture today9/30/14 • Standard Deviation • Variance • Exploring connection among: • Probability, proportion and area of curve • with z scores and raw scores
Review Notations The standard deviation (population) 1. What does this symbol refer to? sigma • What is it called? • What does it mean? • Is it referring to a sample or population? population The mean (population) 2. What does this symbol refer to? mu • What is it called? • What does it mean? • Is it referring to a sample or population? population The mean (sample) 3. What does this symbol refer to? x-bar • What is it called? • What does it mean? • Is it referring to a sample or population? sample The standard deviation (sample) 4. What does this symbol refer to? s • What is it called? • What does it mean? • Is it referring to a sample or population? sample 5. What does this symbol refer to? Each individual score
Review Notations population sample 6. What does this refer to? Variance • What are they called? • What do they refer to? • How are they different S squared Sigma squared 7. What does this refer to? sample population Deviation scores • What are they called? • How are they different population sample 8. What do these two refer to? Sum of squares • What are they called? • How are they different 9. What does this refer to? Degrees of freedom • What is it called? • Use it for sample data or population? sample
Review notations Standard Deviation 10. What does this refer to? • What are they called? • What do they refer to? • How are they different population sample Variance 11. What does this refer to? • What are they called? • What do they refer to? • How are they different population sample 12. What does this refer to? z score • What is this called? • What does it mean? Distance from the mean (counting by standard deviations)
z scores z score: A score that indicates how many standard deviations an observation is above or below the mean of the distribution z score = raw score - mean standard deviation How are standard deviations (or z scores) related to probability (also known as area under the curve or proportion of curve or percent of curve)
Mean = 100 Standard deviation = 5 If we go up one standard deviation z score = +1.0 and raw score = 105 z = +1 z = -1 68% If we go down one standard deviation z score = -1.0 and raw score = 95 85 90 95 100 105 110 115 If we go up two standard deviations z score = +2.0 and raw score = 110 z = +2 z = -2 95% If we go down two standard deviations z score = -2.0 and raw score = 90 85 90 95 100 105 110 115 If we go up three standard deviations z score = +3.0 and raw score = 115 99.7% z = +3 z = -3 If we go down three standard deviations z score = -3.0 and raw score = 85 85 90 95 100 105 110 115 z score: A score that indicates how many standard deviations an observation is above or below the mean of the distribution z score = raw score - mean standard deviation
Thank you! See you next time!!