Download
1 / 1
10 likes | 151 Vues
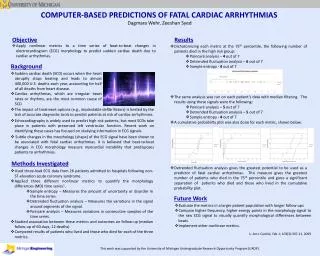
Dagmara Wehr , Zeeshan Syed. Dichotomizing each metric at the 75 th percentile, the following number of patients died in the high risk group: Poincaré analysis – 4 out of 7 Detrended fluctuation analysis – 6 out of 7 Sample entropy - 4 out of 7

E N D
DagmaraWehr, ZeeshanSyed • Dichotomizing each metric at the 75th percentile, the following number of patients died in the high risk group: • Poincaré analysis – 4 out of 7 • Detrended fluctuation analysis – 6 out of 7 • Sample entropy - 4 out of 7 • The same analysis was run on each patient’s data with median filtering. The results using these signals were the following: • Poincaré analysis – 5 out of 7 • Detrended fluctuation analysis – 5 out of 7 • Sample entropy - 4 out of 7 • A cumulative probability plot was also done for each metric, shown below. • Detrended fluctuation analysis gives the greatest potential to be used as a predictor of fatal cardiac arrhythmias. This measure gives the greatest number of patients who died in the 75th percentile and gives a significant separation of patients who died and those who lived in the cumulative probability plot. Objective Results • Apply nonlinear metrics to a time series of beat-to-beat changes in electrocardiogram (ECG) morphology to predict sudden cardiac death due to cardiac arrhythmias. Background • Sudden cardiac death (SCD) occurs when the heart abruptly stops beating and leads to almost 400,000 U.S. deaths each year, accounting for half of all deaths from heart disease. • Cardiac arrhythmias, which are irregular heart rates or rhythms, are the most common cause of SCD. COMPUTER-BASED PREDICTIONS OF FATAL CARDIAC ARRHYTHMIAS The impact of treatment options (e.g., implantable defibrillators) is limited by the lack of accurate diagnostic tools to predict patients at risk of cardiac arrhythmias. Echocardiography is widely used to predict high risk patients, but most SCDs take place in patients with preserved left ventricular function. Recent work on identifying these cases has focused on studying information in ECG signals. Subtle changes in the morphology (shape) of the ECG signal have been shown to be associated with fatal cardiac arrhythmias. It is believed that beat-to-beat changes in ECG morphology measure myocardial instability that predisposes patients to arrhythmias. Methods Investigated • Used three-lead ECG data from 26 patients admitted to hospitals following non-ST-elevation acute coronary syndrome. • Applied three different nonlinear metrics to quantify the morphology differences (MD) time series1. • Sample entropy – Measures the amount of uncertainty or disorder in the time series. • Detrended fluctuation analysis – Measures the variations in the signal around segments of the signal. • Poincaré analysis – Measures variations in consecutive samples of the time series. • Studied association between these metrics and outcomes on follow-up (median follow-up of 60 days; 12 deaths) • Compared results of patients who lived and those who died for each of the three metrics. Future Work • Evaluate the metrics in a larger patient population with longer follow-ups • Compare higher frequency, higher energy points in the morphology signal to the raw ECG signal to visually quantify morphological differences between beats. • Implement other nonlinear metrics. 1. Am J Cardiol, Feb 1; 103(3):307-11, 2009 This work was supported by the University of Michigan Undergraduate Research Opportunity Program (UROP).