Download
1 / 10
100 likes | 231 Vues
Weight (in pounds). Height (in inches). Wake Forest Men’s Basketball. To view data in calculator: Step 1 : Enter data in L1 and L2 Step 2 : Go to y= and move up to select Plot 1 Step 3 : Press Zoom and select 9: ZoomStat for the best viewing window. Introduction to Linear Regression.

E N D
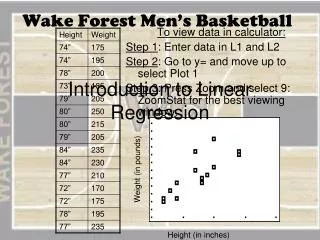
Weight (in pounds) Height (in inches) Wake Forest Men’s Basketball To view data in calculator: Step 1: Enter data in L1 and L2 Step 2: Go to y= and move up to select Plot 1 Step 3: Press Zoom and select 9: ZoomStat for the best viewing window. Introduction to Linear Regression
Wake Forest Men’s Basketball Correlation vs. Causation • What type of correlation is there between height and weight? • Does that mean causation? • Turn Diagnostics On and find the Linear Regression for the data. Step 1: Press 2nd 0 for the Catalog. Scroll to the D’s to select Diagnostic On. Press Enter. Step 2: Press Stat: Calc 4: LinReg.
Wake Forest Men’s Basketball Pearson’s Correlation Coefficient: “r- value” -1 0 +1 Strong negative No Strong Positive Correlation Correlation Correlation Correlation vs. Causation What type of correlation exists between the player’s height and weight?
Wake Forest Men’s Basketball Graph and Residuals Residual – The distance from the data points to the line. Which points have positive residual? Which points have negative residual? To find the “Least Squares Regression” statisticians try to minimize the distance between the residuals and the line of best fit.
Wake Forest Men’s Basketball Interpolation vs. Extrapolation If another basketball player joined the team and he was 69 inches tall, how much would he weigh according to the linear regression line? Approximately 163 pounds This is known as EXTRAPOLATIONbecause we are using a value outside of the data’s range. May or may not be a good prediction.
Wake Forest Men’s Basketball Interpolation vs. Extrapolation What if a player weighed 225 pounds, how tall would he be? Then, according to the data he would be around 81 inches tall. This is INTERPOLATION, because the value is within the ranges of the data. The answer would be more likely to be correct for a prediction. Enter y2 = 225 Find the intersection of the two lines.
NFL Average Points per Game and Yards/Completion2010 Season Pearson’s Correlation Coefficient • How strong is the correlation? Is there one? • Would this be a good model for prediction? Why or why not?
Predictions • What would someone’s GPA be if he/she watched 5 hours of TV? Is this a good model to use for this prediction? • If someone’s GPA was a 3.1, what would this data say about the number of hours he/she watched TV?