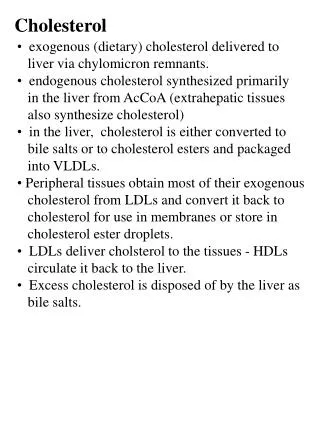
Measuring cholesterol by L-B
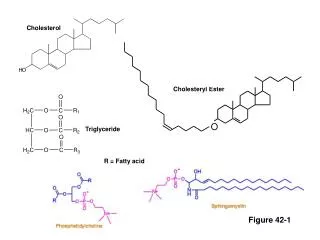
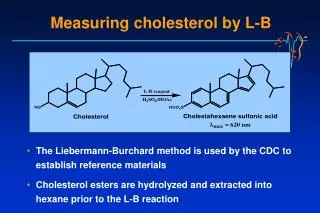
Measuring cholesterol by L-B. The Liebermann-Burchard method is used by the CDC to establish reference materials Cholesterol esters are hydrolyzed and extracted into hexane prior to the L-B reaction. Cholesteryl ester hydroxylase. Cholesterol. Cholesterol oxidase.

Measuring cholesterol by L-B
E N D
Presentation Transcript
Measuring cholesterol by L-B • The Liebermann-Burchard method is used by the CDC to establish reference materials • Cholesterol esters are hydrolyzed and extracted into hexane prior to the L-B reaction
Cholesteryl ester hydroxylase Cholesterol Cholesterol oxidase Choles-4-en-3-one + H2O2 Phenol 4-aminoantipyrine Peroxidase Quinoneimine dye (max500 nm) Enzymatic cholesterol methods Cholesterol esters • Enzymatic methods are most commonly adapted to automated chemistry analyzers • The reaction is not entirely specific for cholesterol, but interferences in serum are minimal
Dextran sulfate HDL, IDL, LDL, VLDL HDL + (IDL, LDL, VLDL) Mg++ Measuring HDL cholesterol • Ultracentrifugation is the most accurate method • HDL has density 1.063 – 1.21 g/mL • Routine methods precipitate Apo-B-100 lipoprotein with a polyanion/divalent cation • Includes VLDL, IDL, Lp(a), LDL, and chylomicrons • Newer automated methods use a modified form of cholesterol esterase, which selectively reacts with HDL cholesterol
HDL-C • Determined using an anti human-β-lipoprotein antibody that binds to non-HDL lipoproteins and allows the quantification of HDL-C by the presence of a cholesterol esterase and cholesterol oxidase/peroxidase (CHE and CHO/POD) enzyme chromogen system • Need for saline dilution when the triglycerides >1000 mg/dL (11.3 mmol/L)
HDL-C • Audit - 0/18 specimens with triglycerides >1000 mg/dL were diluted • So, we decided to dilute when triglycerides >1000 mg/dL • Re-audit - 0/17 specimens with triglycerides >1000 mg/dL (11.3 mmol/L) were diluted
HDL-C • So, we decided to investigate the use of an automated alert for the technical staff via the LIS • Re-audit showed that of 21/25 specimens with triglycerides >1000 mg/dL were diluted
HDL-C • Can we improve on this? • Middleware may automatically result in: • dilution • re-analysis • phoning of results
Lipase Glycerokinase ATP Glycerol + FFAs Glycerophosphate + ADP Glycerophasphate oxidase Peroxidase Dihydroxyacetone + H2O2 Quinoneimine dye (max 500 nm) Measuring triglycerides Triglycerides • LDL is often estimated based on triglyceride concentration, using the Friedewald Equation: [LDL chol] = [Total chol] – [HDL chol] – [Triglyceride]/2.19
IS IT NOT EASIER TO PUT STATINS IN TAP WATER? Pat Twomey Royal Infirmary Edinburgh
INTRODUCTION • Atherosclerosis-related disease is the principal cause of mortality in the Western world • Atherosclerosis-related disease is destined to become the principal cause of worldwide morbidity by 2020
INTRODUCTION • How do we identify which patients would benefit from cardiovascular risk factor intervention as universal pharmacological treatment is not • practically possible, • economically feasible nor • psychologically desirable
INTRODUCTION • Do we treat individual risk factors? • Raised Cholesterol • Low HDL-C • Raised BP • What threshold?
Serum Cholesterol Levels in Men* Framingham Heart Study 40 MI No MI 30 % Population 20 10 0 150 200 250 300 350 400 450 (mg/dl) (mmol/L) 3.9 5.2 6.5 7.8 9.1 10.3 11.6 Serum cholesterol *During first 16 years of study: Entry ages 30–40 years Adapted from Castelli WP Can J Cardiol 1988;4(suppl A):5A-10A.
FRAMINGHAM EQUATIONS • Several sets of data • 1967 • 1973 • 1976 • 1991 • 1998 Cardiovascular disease risk profiles Am Heart J 1991; 121:293-8.
FRAMINGHAM EQUATIONS • Within each set, there are different disease types • a CHD risk • b Stoke risk (inc TIA) • c Total cardiovascular disease risk • d MI • e Death from CHD • f Death from cardiovascular disease Cardiovascular disease risk profiles Am Heart J 1991; 121:293-8.
FRAMINGHAM EQUATIONS • = 15.5305 + (28.4441*sex) + (-1.4792*ln(age)) + (-14.4588*ln(age)*sex) + (1.8515*(ln(age)2)*sex) + (-0.9119*ln(sysBP)) + (-0.2767*smoker) + (-0.7181*ln(t-cho/HDL-cho)) + (-0.1759*diabetes) + (-0.1999*diabetes*sex) + (-0.5868*LVH) • = e(0.9145 + (-0.2784*m) p(CHD – 10-yr) = 1-e(-e(ln(10)-m/s)) Sex: Male = 0; female = 1 DM, smoke, LVH: 0 = No; 1 = Yes Cardiovascular disease risk profiles Am Heart J 1991; 121:293-8.
FRAMINGHAM EQUATIONS Joint British Recommendations Dec 1998
FRAMINGHAM EQUATIONS Joint British Recommendations Dec 1998
FRAMINGHAM EQUATIONS • The Framingham equations are derived by parametric regression model of epidemiological data • The results produced are valid for populations • Each population coefficient in the risk equation is subject to a confidence interval Cardiovascular disease risk profiles Am Heart J 1991; 121:293-8.
FRAMINGHAM EQUATIONS • Extrapolation to individuals is assumed by many • In addition, it is assumed that precise results can be obtained from one determination of risk factor status and thus neglect the role of variation.
What we think we’re doing One Target: One Bullet
What we think we’re doing Take Aim
What we think we’re doing Getting closer
What we think we’re doing Identify the different individual from the crowd
What we think we’re doing (1) Too Many Targets Some scoring systems miss
What we think we’re doing (2) Bad Marksmanship
BIOLOGICAL VARIATION • Average population CV • Total Cholesterol 6.5% • HDL-C 7.5% • SBP 7%
ANALYTICAL VARIATION • CV • Total Cholesterol 2.5% • HDL-C 3.4% • SBP 5%
TOTAL VARIATION • CVtotal = [CVbiological2 + CVanalytical2]1/2 • Total Cholesterol 6.9% • HDL-C 8.2% • SBP 8.6%
TOTAL VARIATION • Average population 95% CI • TC 5.0 +/- 0.7 mmole/L • HDL-C 1.0 +/- 0.16 mmole/L • SBP 140 +/- 24 mm Hg
TOTAL VARIATION • CVtotal = [CVChol2 + CVHDL-C2 + CVSBP2]1/2 • CVtotal = [6.92 + 8.22 + 8.62]1/2 • CVtotal = 13.7%
POPULATION SIMULATION • Population of 5,000 males and 5,000 females Add intra-individual and laboratory variation (100 simulants for each individual) and calculated CHD risk
POPULATION SIMULATION • Different Cholesterol & HDL-C data used for male & female • Lipids based on the Health Survey for England 1998 • Correlation between Cholesterol & HDL-C achieved by Polar-Marsaglia-Bray Cholesky decomposition matrix method
POPULATION SIMULATION • Smokers - random 25% • Assumed no diabetics • SBP as per the Health Survey for England 1998 • Age range 30 - 70
POPULATION SIMULATION • LVH defined randomly but with a different frequency for hypertensive & normotensive groups • LVH assigned according to known population frequencies - 29.4 cases /1000 hypertensive simulants (defined as systolic BP >= 160mmHg) and 6.4 cases / 1000 normotensive simulants (defined as systolic BP < 160mmHg)
CUMULATIVE FREQUENCY DISTRIBUTION • > 15% 10 year CHD risk 15.0% • > 20% 10 year CHD risk 7.65% • > 30% 10 year CHD risk 1.54%
SINGLE v TRIPLICATE • For every 100 whose mean risk >= 30% threshold • 20 v 15 false positives • 30 v 11 false negatives • 50 v 26 incorrectly assigned
SINGLE v TRIPLICATE • For every 100 whose mean risk >= 20% threshold • 18 v 10 false positives • 16 v 11 false negatives • 34 v 21 incorrectly assigned