
Uploaded by
kaiser
2 SLIDES
102 VUES
20LIKES
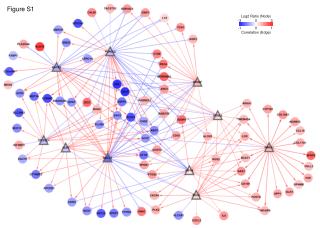
Gene Expression Correlation Analysis in Network Nodes
DESCRIPTION
Explore gene expression correlation in network nodes using log2 ratio values. Significance indicated through Sig. values. Compare MRA and MRA+SLR analysis. Genes identified with P-values of 0.01 and 0.05.
Download
1 / 2
Télécharger la présentation 
Gene Expression Correlation Analysis in Network Nodes
An Image/Link below is provided (as is) to download presentation
Download Policy: Content on the Website is provided to you AS IS for your information and personal use and may not be sold / licensed / shared on other websites without getting consent from its author.
Content is provided to you AS IS for your information and personal use only.
Download presentation by click this link.
While downloading, if for some reason you are not able to download a presentation, the publisher may have deleted the file from their server.
During download, if you can't get a presentation, the file might be deleted by the publisher.
E N D


More Related