Comparison of Comparative Genomic Hybridization Technologies Across Microarray Platforms
340 likes | 699 Vues
Comparison of Comparative Genomic Hybridization Technologies Across Microarray Platforms. The 2007 Microarray Research Group Project. Susan Hester April 1, 2007. Two goals for this presentation: Present a Comparative Genomic Hybridization Study to the ABRF research community

Comparison of Comparative Genomic Hybridization Technologies Across Microarray Platforms
E N D
Presentation Transcript
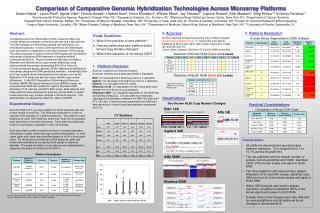
Comparison of Comparative Genomic Hybridization Technologies Across Microarray Platforms The 2007 Microarray Research Group Project Susan Hester April 1, 2007
Two goals for this presentation: • Present a Comparative Genomic Hybridization • Study to the ABRF research community • 2. Evaluate commercial CGH platforms for their • ability to detect known gains or losses
Background • Comparative Genomic Hybridization (CGH) measures DNA • copy number differences between a reference genome and • a test genome. • Early CGH experiments, the DNA targets were hybridized • to metaphase chromosome spreads in FISH assays. • This technology later evolved: DNA targets are hybridized • to microarrays containing cDNA fragments or bacterial • artificial chromosomes (BACs). • Commercial microarrays are characterized as whole-genome • CGH measures, obtaining copy number differences in DNA • across entire genomes.
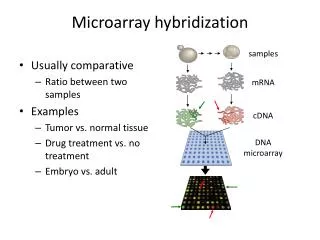
What is CGH and what is it not? • CGH has nothing to do with gene expression. • CGH arrays are structural, not functional—they look for DNA that is • missing or duplicated, not DNA that is expressed. • In array CGH, thousands of probes are printed on a microscope slide. • These probes are bacterial artificial chromosomes, or BACs, which are • sequences of cloned human DNA 120-180Kb long that have been mapped • to specific locations on specific chromosomes. • To the array is added test DNA and reference or control DNA, each • labeled with a different dye. The essence of the experiment is that the two • DNA samples compete for hybridization to the BAC probes on the slide, • thus the "comparative" aspect of CGH.
The 2007 MARG Study: The research question: How well do BAC and commercial CGH arrays detect known copy number gains or losses in test and reference DNA? • Analyzed Human leukemic HL60 DNA compared to reference with 5 platforms: RPCI BAC 19K arrays, Agilent 44K, Illumina HAP 550K, Affymetrix 500K, and Affymetrix U133 expression array. • DNA samples analyzed in quadruplicate. • 3 different laboratory test sites; Roswell Park Cancer Institute, Memorial Sloan-Kettering Cancer Institute, and Columbus Children’s Hospital. • Quality assessment of each platform performed by each test site.
Known copy number gains and losses on cell line HL-60* • Amplification of the 8q24 locus, Trisomy 18 • Deletions at loci 5q11.2-q31, 6q12, 9p21.3-p22, • 10p12-p15, 14q22-q31, 17p12-p13.3, monosomy X *Cancer Genet Cytogenet. 2003 Nov;147(1):28-35; Peiffer et al.(2006)
The fundamental theory behind each platform*: nucleotide base-pairing -_-- - -_--- -_-- - -_--- -_-- - -_--- -_-- - -_--- Before: hybridization: DNA sample (varying locus concentrations reflecting inherent gains/losses) Chromosome #1 probes _ _ _ _ _ _ _ _ _ _ _ _ Afterhybridization: DNA sample labeled and fragmented _ _ _ _ __ _ _ _ __ _ _ _ _ __ _ _ _ _ _ _ _ _ _ _ _ _ _ _ _ _ _ _ _ _ _ _ gain gain gain *in this example; one color platform loss loss
Example of Array CGH Technology* *in this example; 2-color platform Chari et al, Cancer Informatics, 2006, 2, 48-58
Platform Details The test sites were: 1Roswell Park Cancer Institute, Buffalo, NY,2Sloan-Kettering Institute Genomic Core, Rochester, NY 3Columbus Pediatric Hospital, Columbus Ohio
Study Questions: 1. What is the precision of each platform? 2. How accurately does each platform detect known copy number changes? 3. What is the resolution of array CGH?
Results: Assessment of precision- coefficient of variation across replicates
Platform Visualizations: Chromosome 8 gain Chromosome 17 deletion Chromosome 5 deletion
chr8 3 2 1 0 -1 -2 RPCI BAC 19K array chr17 3 +8q24 -17p12 2 1 0 -1 -2
Agilent 44K Chr. 5q deletion
Visualization of each platform: Illumina HAP 550K Chr. 5q deletion Replicate 1 Replicate 2 Replicate 3 Replicate 4 -5q11
Affymetrix U133 Gene Expression Array Chromosome 17
Partek: Affy500K Chr 17p deletion Replicate 1 Replicate 2 Replicate 3 Replicate 4
Results: Assessment of Accuracy: concordance with known gains/losses red=amplification black=loss
Results: Assessment of platformresolution • Circular binary segmentation analysis (CBS)* • This approach is used to translate noisy intensity • measurements into regions of equal copy number. • Detects the point at which signal changes. • Log ratios of normalized signal intensities are used. • log2 (signal HL60/ref DNA) • ex: normal state is 2copies/2copies=1 • log2 (1)=0 *Olshen, A.B. et al. (2004)-Circular Binary Segmentation for the Analysis of array-based DNA Copy Number Data
Adopted;http://www.birc.dk/bioinformatics2006/talks/BrennanBioinf2006.pdfAdopted;http://www.birc.dk/bioinformatics2006/talks/BrennanBioinf2006.pdf
Circular Binary Segmentation CBS Calculation Point of transition in signal Simulated Intensity Ratio Segment
Assessment of platform resolution on a known • deletion or gain: • RPCI BAC 19K • Agilent 44K • Illumina HAP550 • Affymetrix U133 Gene Expression • Affymetrix 500K
If 1 copy present in HL-60 and 2 in ref; then intensity ratio= ½=0.5; log2(0.5)= -1 Log2 between 0 & -1= 1cn loss Log2 between 0 & 0.5= 1cn gain Log2 between 0.5 & 1= 2cn gain
CBS Summary Details for known gains/losses: Deletion Chr.5 and Gain Chr.8 *used only probes>10 **Data generated using Partek Software to determine gains/losses; Green= deletion Red=gain
Did Agilent underestimate the change? Chr.8 -entire view zoomed-in view of amplification at 120 to 130Mb follows
CBS 2.011 CBS 1.1630 CBS 1.612 CBS 0.3993 Results: • lowest CBS ratio value andsmall dynamic range • of our Agilent data compared to other platforms; • huge number of segments in Illumina data
CBS analysis finds 3 novel gains or losses** • BAC& Affy500K agree -Chromosome 2 • Illumina, Agilent, Affy GE, BAC and Affy500K • all agree on Chromosome 16 • Affy500K and Affy GE agreement on Chromosome 19 ** Agreement means that 2 of the 5 platforms found the same gain or losses in the same location (start to end location)
Table of Novel Gains and Losses Red=gain Black=loss
Conclusions • Good precision across all platforms: CVs ranged from 2.1 to 10.7% across the platforms • Illumina and Affymetrix 500K identified 9 of 9 (100%) of the known losses and gains in HL60 DNA • Agilent, Affymetrix U133 gene expression, and RPCI BAC arrays identified 8 of 9 (89%) of known losses and gains in HL60 DNA • CBS used to assess resolution of each platform; all platforms detected known gains/losses • 3 novel changes were also detected by at least 2 or more platforms
Acknowledgments The Microarray Research Group (MARG): Susan Hester, Laura Reid, Agnes Viale, Norma Nowak, Herbert Auer, Kevin Knudtson, Bill Ward, Jay Tiesman, Caprice Rosato, Aldo Massimi, Greg Khitrov, and Nancy Denslow Laboratory test sites: Roswell Park Cancer Institute, Memorial Sloan-Kettering Cancer Institute, and Columbus Children’s Hospital Data analysis efforts: US Environmental Protection Agency Roswell Park Cancer Institute Columbus Children’s Hospital Expression Analysis Funding support for this project: The Executive Board of the Association of Biomolecular Resource Facilities