Download
1 / 44
440 likes | 456 Vues
This seminar explores the connection between climate change and public health, addressing impacts, adaptation, and policy implications. Learn how climate change affects health, including heatwaves, vector-borne diseases, and extreme weather events.

E N D
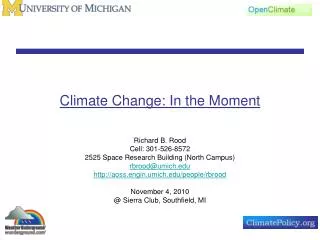
Climate Change: The Move to Action(AOSS 480 // NRE 501) Richard B. Rood 734-647-3530 2525 Space Research Building (North Campus) rbrood@umich.edu http://aoss.engin.umich.edu./people/rbrood Winter 2008 April 3, 2008
Class News • Class Web Site and Wiki • Climate Change: The Move to Action • Winter 2008 Term
Next 4 lectures • April 3: Report from BP / Exxon // Continuity / Public Health and Climate • April 8: Business and Climate // Discussion • April 10: Current Issues // Discussion • April 15: Final Presentations • April 21: Submission of Final Presentation. (.ppt and .doc) (April 24, absolute latest!)
Extra Special Seminar You Can Argue With the Facts: A Political History of Climate Change Naomi Oreskes University of California, San Diego Monday, 7 April 2008 4:00–5:30 pm Betty Ford Classroom, Weill Hall, Rm 1110
Seeking Project Happiness Presentation: Total time for presentation and questions is 30 minutes. Aim for presentation of 20 minutes. My goal, here, is something like a real world experience. Therefore, first get the presentation “right.” Paper: There should be an accompanying narrative to the presentation. This should include references. Minimally: Narrative is description of the presentation. Target: Narrative in the spirit of executive summary, or “white paper” that the receiver of the presentation can take away and “carry forward.” Needs Abstract. 10 pages is a good target. If it is longer than 10 pages needs an Executive Summary. (Due April 21, Latest April 24) If you want to write more it is great! I’ve had as high as 60 pages by groups who really did plan, and did, take them forward. You should feel like you have done a good job, in the time that you have.
Readings on Local Servers • Assigned • WHO: Climate Change and Public Health • McMichael: Analysis of Health Impact, Inequality, and Health Sector • Of Interest • Meehl and Tebaldi: Climate Change and Heat Waves • Watson: Overview of Science, Policy, Public Health, etc. • Foundational Reading • McKinsey: Climate Change Special Initiative
Outline of Lecture • Projects • Revisit fingerprinting and attribution • Questions • Public health and climate change: A paradigm problem • Heatwaves
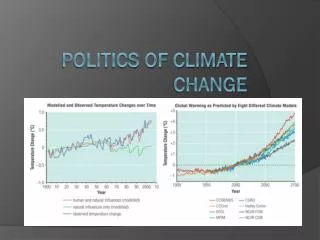
Fingerprinting The Basic Idea: Postulate that climate changes for both “natural” and “anthropogenic” components. Climate measurements contain both components of change. Model forcing can be written with separate natural and anthropogenic forcing. Model simulation with natural forcing is used as a proxy for the natural climate. Is the observed climate significantly different from the proxy natural climate?
Fingerprinting The Basic Idea: Is the observed climate significantly different from the proxy natural climate? AND And is the observed climate statistically the same as the model simulated natural plus anthropogenic forcing?
Section 2: Studying the Causes of Climate Change (From Ben Santer) Human-caused fingerprints have been identified in many different aspects of the climate system Surface specific humidity Water vapor over oceans Tropospheric temperatures Stratospheric temperatures Tropopause height Ocean temperatures Sea-level pressure Atmospheric temperature Zonal-mean rainfall Near-surface temperature Continental runoff
Climate Change and Public Health • Public Health, esp. heatwaves, will be used as an example to show the elements of a real problem and its relation to climate change. • How does it relate to mitigation, adaptation? • policy • law • etc.
Climate Change and Public Health • Acknowledgement and thanks to • Marie S. O’Neill (Michigan) • Sabrina McCormick (Pennsylvania)
Pathways by Which Climate Change Affects Health WHO: Climate Change and Public Health
Health Impacts of Climate Change • Increased heat waves and shifts in urban air quality • Vector born diseases • Range and seasonality of infectious diseases • Rising sea levels and extreme weather events = dislocation, environmental refugees = global security issue • Threatened food supply, release of toxins into environment • Decrease in water quality
Vector Born Disease • Dengue, malaria, west nile virus, others • Differential exposure on a global level • Some unexpected by products - spraying may cause chronic disease, drug resistance
Extreme Weather Events • Injuries and death • Long term psychological problems • Increased infectious disease • Contaminated water supplies
Quantifying and forecasting climate change public health impacts • Colder climates, e.g., Netherlands, may benefit • Hotter climates may have more effects with projected rise of 1.4-5.8o C • Overall expected impact: increased weather-related deaths
Useful way to think about impact and adaptation BAD GOOD Temperature (other environmental parameter)
For many things: living things and ecosystems • There is an optimal range of an environmental parameter, e.g. temperature or moisture. • Above or below this range risk increases • The function looks like a parabola • May be skewed
Skewed towards hot being dangerous BAD GOOD Temperature (other environmental parameter)
Skewed towards cold being dangerous BAD GOOD Temperature (other environmental parameter)
Analysis • You would analyze this impact by:
Heatwaves • Public health experts count heatwaves as the most consequential environmental health risk. • examples are Chicago Heat Wave 1995, European Heat Wave 2003
What is a heatwave? • Not so easy to define, because we have now brought in the human dimension. • Not the same in Houston and Chicago • Extreme high heat? • Persistent high heat?
Humans and heat • Environmental heat exposure • Exercise induced heat • Ability to cool
An observation • Extreme heat and exercise • greater than 105 is bad! • Persistent heat combined with environmental heat exposure and ability to cool • strongly dependent on acclimation • persistent night time minimum temperatures are high • this has been the most deadly
Heat Waves in Future Observed Modeled Predicted change in the future Meehl and Tebaldi, Science, 2004
Heatwaves in future • More frequent • More intense • Greater duration
The heatwave problem • This problem already exists (short term). • Climate change will amplify it. • Mitigation of greenhouse gases will have only indirect effect (long term) • What are the most effective responses?
Levels of vulnerability to extreme temperature • Biomedical • underlying disease (CVD, diabetes), co-exposures, genetics, nutrition, medication use • Socioeconomic position • individual traits, neighborhood features • Geography • Topography and settlement patterns, housing, air conditioning access, acclimatization to prevailing temperature conditions
Spatial variation of heat sensitivity Pop > 85 Long-term limiting illness Living in a flat Living in medical/care institutions Deprivation
Convergence of Surface temperature hotspots and areas of high sensitivity Is this pattern of joint occurrence a good predictor of the spatial Variation of mortality?
Insights from sociology/geography • 1995 Chicago heat wave: neighborhood influences at small scale • Population stability, social structure more predictive than race Eric Klinenberg (2002) Heat wave: A social autopsy of disaster • St. Louis: spatial features (heat island, concentrated poverty) determined risk Smoyer-Tomic, K, Social Science & Medicine, 1998
Social Networks & Illness Social network measures: Marriage, contact with friends and family, church membership and formal/ informal memberships 9 year prospective study Berkman and Syme in House et al 1988.
There are Adaptation Measures • Federal versus city-level • Existing: • Heat warning systems • Emergency management • Air conditioning
LOCAL GLOBAL SPATIAL We keep arriving at levels of granularity WEALTH TEMPORAL NEAR-TERM LONG-TERM Small scales inform large scales. Large scales inform small scales.
Lessons from heat waves • Existing problem with existing system to address the problem • Some good, some bad • Strongly dependent on extreme events, not the average • Hence want to know how extreme events will change • Not clearly and distinctly addressed by efforts to mitigate greenhouse gas emissions • Motivator for “Kyoto like” policy?
Lessons from heat waves • Strongest levers for addressing the problem are • Societal capability (social integration, structure, communications) • Environmental warnings and alerts • Education (first responders, general public, ....) • Engineering (air conditioners, green spaces, ...)
Lessons from heat waves • Policy focused specifically at heat waves • local adaptation • mitigation of heat in built environments.
Where do Impacts sit in relation to policy • Heat waves have been used as an example.