Download
1 / 1
10 likes | 86 Vues
Explore a normative model of public perceptions on border inspectors' decision-making process, inspection constraints, and detection strategies. Learn about the trade-offs between security and inspection capacity at international ports of entry.

E N D
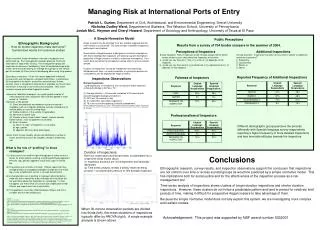
Patrick L. Gurian, Department of Civil, Architectural, and Environmental Engineering, Drexel University Nicholas Dudley Ward, Department of Statistics,The Wharton School, University of Pennsylvania Josiah McC. Heyman and Cheryl Howard, Department of Sociology and Anthropology, University of Texas at El Paso A Simple Normative Model Public Perceptions Results from a survey of 704 border crossers in the summer of 2004. Managing Risk at International Ports of Entry Ethnographic Background How do border inspectors make decisions? Summarized results from previous studies Illegal crossers may be recruited from any societal subgroup but the total number is constrained. The total number of detailed inspections performed is constrained. Recruitment of illegal crossers is designed to minimize interceptions with the knowledge that inspectors will select group with the highest proportion of illegal crossers in order to maximize interceptions. As a result, both recruitment and inspection will be uniform across societal groups. Duration of inspections should be independent and identically distributed over time - no serial correlation or systematic patterns as such patterns can be exploited by illegal crossers. Perceptions of Inspectors Survey Question: Now, I’ll read you some choices, please tell me which comes closer to your views about the inspectors at customs: a. would you say they are: [ ] fair or [ ] unfair or [ ] it depends on the inspector, b. would you say their work is: [ ] professional or [ ] unprofessional or [ ] it depends on the inspector. Additional Inspections Survey Question: In general, how often do you have to submit to additional searches at customs?[ ] Frequently, [ ] Occasionally,[ ] Rarely, or [ ] Never. Major constraint: trade-off between intensity of inspection and traffic build-up. Port management receives pressure from local influentials to keep traffic moving. Port management pressures inspectors to achieve a “satisfactory” level of interdicted drugs while at the same time maintaining an average through-put of one vehicle per 30 seconds (El Paso) and not developing abnormally long queues. Secondary constraints: (A) do not harass apparently influential crossers who will call lawyers, congressional offices, or embassies. (B) incomplete information--access to car and drivers’ license records, visas or immigration documents is available, but much other information is missing or cannot be cross-checked. Only a few crossers receive automated fingerprint checks. Reported Frequency of Additional Inspections Fairness of Inspectors Inspections Observations Normal Inspections 1,228 inspections of northbound, non-commercial traffic observed at Santa Fe Bridge in El Paso, TX (1) Average duration = 34 seconds compared to 30 second goal (see ethnographic background section) (2) 45% last 20 seconds or less (3) 2% referred to secondary inspections (4) 79% do not involve opening a vehicle compartment Based on Villegas, Gurian, Heyman, et al. 2006. “Tradeoffs between Security and Inspection Capacity: Policy Options for Land Border Ports of Entry”, Proceedings of the Annual Meeting of the Transportation Research Board, Washington, DC (accepted) Inspectors’ detection strategies: an overall gestalt created of many factors at once; inspectors often call this gestalt a “sixth sense” or “intuition.” Elements of the gestalt: (1) Direct documentary and detection system evidence if available, such as computer database records (intelligence) of vehicle plates or narcotic sniffing dogs. (2) Visible condition of the vehicle (if applicable). (3) Nerves/non-verbal cues. (4) Traveler’s story: does it make “sense” (various socially based rubrics, such as apparent social class). (5) Kind of traveler: (a) nation of origin; immigration or visa status. (b) age, gender. (c) apparent ethnicity (body phenotype). Goals: traffic moves steadily, officers get satisfactory number of busts, and avoid criticism by congress, lawyers, embassies, etc. Professionalism of Inspectors Different demographic groups perceive the process differently with Spanish-language survey respondents reporting a higher frequency of more detailed inspections and less favorable attitudes towards the inspectors. What is the role of “profiling” in these strategies? It does occur: the need for rapid through-put of traffic results in tactics for quick decision-making, including profiling by apparent ethnicity, age, gender, apparent social class, type of vehicle, etc. The profiles are not static or simple. Officers report that they change profiles as smuggling strategies change but how much lag or over-simplification occurs is not well-documented. A characteristic use of profiling to manage traffic/interdiction trade-offs was a remark by a port manager who said they did not want time wasted by inspectors on “grandmas.” In fact, smugglers use many kinds of crossers but simplifications help officers and supervisors satisfy constraints. (3) The application of profiles differs between officers, but this is complex and not well understood. Duration of inspections Half-hour observation periods have been concatenated into a single time series shown above. (1) Inspection durations are not independent and identically distributed. (2) Time-series analysis reveals a weakly mean-reverting process – consistent with pressure to limit average inspection time and maintain traffic flow. Conclusions Ethnographic research, survey results, and inspection observations support the conclusion that inspections are not uniform over time or across societal groups as would be predicted by a simple normative model. This has implications both for social justice and for the effectiveness of the inspection process as a risk management tool. Time-series analysis of inspections shows clusters of longer duration inspections and shorter duration inspections. However, these clusters do not follow a predictable pattern and tend to persist for relatively brief periods of time, making it difficult for prospective illegal crossers to take advantage of them. Because the simple normative model does not fully explain this system, we are investigating more complex and realistic models. Sources: Heyman, Josiah McC. 2004 “Ports of Entry as Nodes in the World System,” Identities: Global Studies in Culture and Power 11: 303-327. 2001 "United States Ports of Entry on the Mexican Border,” Journal of the Southwest, 43: 681-700 1999 “Why Interdiction? Immigration Law Enforcement at the United States-Mexico Border,” Regional Studies 33: 619-30. Gilboy, Janet 1992 “Penetrability of Administrative Systems: Political ‘Casework’ and Immigration Inspectors,” Law and Society Review 26: 273-314. 1991 “Deciding Who Gets In: Decision making by Immigration Inspectors,” Law and Society Review 25: 571-599. Nature of the data: ethnographic, based on direct observation at land and air ports, interviews at the time of decision of officers, and in-depth interviews of officers. Multiple independent researchers report similar results. Data is not quantified. Data was collected in late 1980s and early 1990s, prior to the current project (2003-2005). Changes since this time period include better detection technologies and stronger access to databases, but limited interviews in 2004 indicate broad applicability to the present. The current project did not have direct access to officers. When 30-minute observation periods are divided into thirds (left), the mean durations of inspections typically differ by ANOVA (right). A single example analysis is shown above. Acknowledgement: This project was supported by NSF award number 0332001