Download
1 / 16
160 likes | 322 Vues
Overview OF STUDENT GROWTH PERCENTiLE ( sgp ). Updated August 2014. Development of Student Growth Percentiles (SGPs) . Federal Mandate for Stimulus Funds: States Must Calculate “Student Growth”; Link Teachers to Students.

E N D
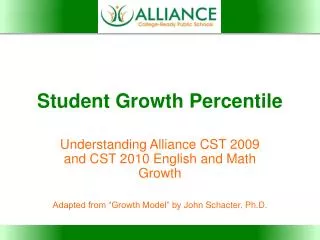
Overview OF STUDENT GROWTH PERCENTiLE (sgp) Updated August 2014
Development of Student Growth Percentiles (SGPs) Federal Mandate for Stimulus Funds: States Must Calculate “Student Growth”; Link Teachers to Students • New Jersey has taken a thoughtful, multi-year approach to ensure SGP data is accurate and usable. • SGP resources and trainings will continue to be provided for educators in 2014 and beyond. • SGP data will continue to be availableto authorized NJ SMART users in every district. District SGP Profile Reports Deployed via NJ SMART SY12-13 Teacher Median SGP Reports Provided to All Districts for Learning Purposes and Data Preview Evaluation Pilot Advisory Committee Provides Feedback on Usefulness of SGP Data Student SGPs Provided to All Districts in NJ SMART SY11-12 Teacher Median SGP Reports Provided to Pilot Districts for Learning Purposes 2015 2010 2012 2013 2011 2014 NJ Adopts SGP Methodology for Calculating Student Growth SGP Training Begins for Districts; SGP Video Released TEACHNJ Act Passed; Growth Measures Required for Evaluation School SGPs Used in School Performance Reports per NJ’s Federal ESEA Waiver SY13-14 Teacher Median SGP Reports Provided to All Districts for Use in Evaluations
Student Growth Percentile Overview Practice Student Achievement TeacherPractice Based on classroom observations Student Growth Objective(SGO) Set by teacher and principal Student Growth Percentile (SGP) Based onstate assessment performance Summative Rating Overall evaluation score Less than 20 percent of teachers All teachers and principals Student Growth Percentiles
Calculating Student Growth Percentiles • Student Growth Percentiles (SGPs) measure how much a student has learned from one year to the next compared to students with a similar performance history from across the state (“academic peers”). All students can show growth.
Why Student Growth? A student’s NJ ASK score does not tell the whole story. 250 Advanced Proficient 220 230 205 Maria NJ ASK Scale 200 Proficient 165 160 Albert 150 100 Partially Proficient Gr. 3 Gr. 4 Gr. 5 NJ ASK Scale Score by Grade Under our current system, schools and parents might only notice that Maria is “Proficient” and that Albert is “Partially Proficient.”
SGP Considers Growth, Not Proficiency • Albert has taken the 5th-grade NJ ASK. How does his score compare to those of his academic peers? Academic Peers’ Prior Scores Albert’s Prior Scores
Determining an SGP Albert’s Academic Peers’ NJ ASK Scores Albert’s 5th-Grade NJ ASK Score Advanced Proficient 250 Advanced Proficient 250 Proficient 200 NJ ASK Score 160 29% 165 200 Proficient 150 200 160 150 70% Partially Proficient 100 110 Partially Proficient 100 Gr.3 Gr.4 Gr.5 Gr.3 Gr.4 Gr.5 • Albert scored 165. His academic peers scored between 110 and 200. How did Albert do in comparison to them?
Determining an SGP Albert’s Score Academic Peers’ Scores • SGP • A comparison to his academic peers allows us to see that Albert actually outperformed 70% of students who, up until this year, performed in a similar manner to Albert. His SGP score is 70. 1% 70% 99%
Determining a Teacher’s mSGP Rating • Albert’s SGP is arranged along with the SGPs of all his teacher’s students from low to high. Median SGP Score • Albert’s teacher receives an effectiveness rating by taking the median SGP score – in this case, 51. 9
mSGP Qualification and Weighting • To receive an mSGP score, teachers must: • Teach a 4th–8thgrade Math or Language Arts class, and • Be the teacher of record for at least 60% of the course prior to the assessment, and • Have at least 20 students with valid SGP scores who are enrolled in the class for at least 70% of the school year before they take the test. • About 15-20% of New Jersey teachers will qualify 45% Student Achievement 55% Teacher Practice *weights pending approval of related regulations by the State Board
mSGPTechnical Rules Median this Year = 51 Median over 2 years = 56 • In future years, teachers should know that: • If two or three years of data are available, the Department will use the best available score — either the teacher’s median score of their current roster or the median of all student scores over the years available. The SGP score will then be placed on a 1.0 - 4.0 scale.
mSGP Conversion from 1 - 99 to 1.0 - 4.0 • Based on the mSGP score, Albert’s teacher receives a rating of 3 for this component, which is then combined with other evaluation components to get a summative rating.
SGP Conversion Chart Explained • Why are all the values between 45 and 55 set to the same score (3.0)? • The Department believes that educators in the middle of the mSGP distribution are driving significant academic growth in their students. • Educators whose students achieve scores in this range should be recognized by receiving a rating on par with their impact.
SGP Conversion Chart Explained • Why are the values at the extreme ends of the distribution, 1-20 = 1 in this case (and 80-99 = 4), set to the same score? • When more than half of a teacher's students are in the top 20 percentile points on the SGP scale it is an indication of very high growth. • When more than half of a teacher's students are in the bottom percentile points this is an indicator of low growth to be considered with other evidence.
SGP Conversion Chart Explained • Why Decimals? Why Tenths? • The use of decimals instead of whole numbers enables the scale to increase/decrease gradually, improving the statistical efficiency of the conversion. • This prevents large rating differences that may not accurately reflect significant differences in student learning.
Find out more: www.nj.gov/education/AchieveNJ http://www.nj.gov/education/AchieveNJ/teacher/percentile.shtml educatorevaluation@doe.state.nj.us 609-777-3788