Chapter 17 Overview of Multivariate Analysis Methods
Chapter 17 Overview of Multivariate Analysis Methods. statistical techniques used when there are multiple measurements of each element/concept and the variables are analyzed simultaneously.

Chapter 17 Overview of Multivariate Analysis Methods
E N D
Presentation Transcript
statistical techniques used when there are multiple measurements of each element/concept and the variables are analyzed simultaneously. These techniques are important in marketing research because most business problems are multidimensional and can only be understood when multivariate techniques are used. Multivariate Analysis 17-2
Classification of Multivariate Methods We’ve already discussed ANOVA, MANOVA, Correlation, Multiple Regression, and Perceptual Mapping. 17-3
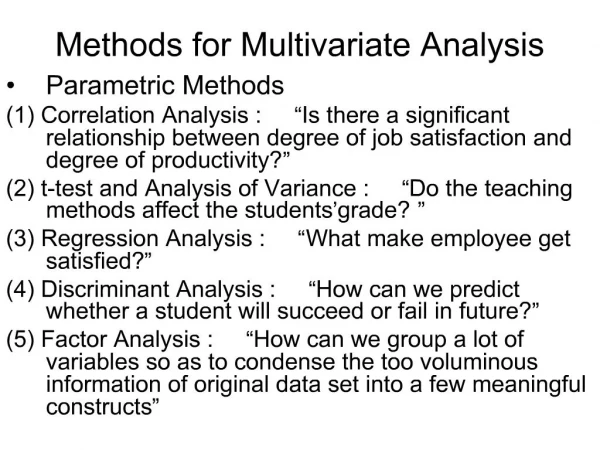
Dependence – multivariate techniques appropriate when one or more of the variables can be identified as dependent variables and the remaining as independent variables. Interdependence – multivariate statistical techniques in which a set of interdependent relationships is examined – The goal is grouping variables in some way. • Examples: multiple regression analysis, discriminant analysis, ANOVA and MANOVA • Examples: factor analysis, cluster analysis, and multidimensional scaling. Dependence VS INTERDEPENDENCE Methods 17-5
. . . used to summarize information contained in a large number of variables into a smaller number of subsets or factors. • Purpose – to simplify the data. • Dependent and independent variables are analyzed separately, not together. All variables being examined are analyzed together – to identify underlying factors. Factor Analysis 17-6
Examine factor loadings & percentage of variance Steps Decide on number of factors Interpret & name factors Factor Analysis Process 17-7
Factor Loadings are correlations between the variables and the new composite factor. These are the starting point for interpreting factor analysis. They measure the importance of each variable relative to each composite factor. • Like correlations, factor loadings range from +1.0 to –1.0 • Factor loadings are calculated between all factors and each of the original variables. 17-8
classifies objects into relatively homogeneous groups based on the set of variables analyzed. classifies or segments objects into groups that are similar within groups and as different as possible across groups. • identifies natural groupings orsegments among many variables,does NOT include a dependent variable. Cluster Analysis 17-9
Cluster Analysis 17-10
Cluster Analysis COefficients Coefficients 17-12
New Cluster variable New cluster variable 17-13
It’s a dependence technique used for predicting group membership on the basis of two or more independent variables. Dependent variable – nonmetric or categorical (nominal or ordinal). Independent variables – metric (interval or ratio), but non-metric (nominal) dummy variables are possible. Discriminant Analysis 17-14
Develops a linear combination of independent variables and uses it to predict group membership. Characteristics Predicts categorical dependent variable based on group differences using a combination of independent variables. • Discriminant function – a linear combination of independent variables that bests discriminates between the dependent variable groups. Discriminant Analysis 17-15
Estimates of the discriminatory power of a particular independent variable. Discriminant Function Coefficients Multipliers of variables in the discriminant function when variables are in the original units of measurement. Discriminant Analysis 17-16
Discriminant Analysis . The prediction is referred to as the hit ratio. . Shows the number of correctly and incorrectly classified cases . Classification (Prediction) Matrix – shows whether the estimated discriminant function is a good predictor. 17-17