Download
1 / 15
150 likes | 466 Vues
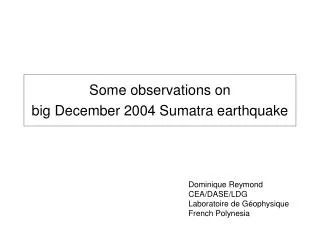
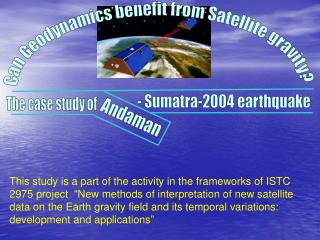
- Sumatra-2004 earthquake. The case study of. Andaman. Can Geodynamics benefit from Satellite gravity?.

E N D
- Sumatra-2004 earthquake The case study of Andaman Can Geodynamics benefit from Satellite gravity? This study is a part of the activity in the frameworks of ISTC 2975 project “New methods of interpretation of new satellite data on the Earth gravity field and its temporal variations: development and applications”
Launched in 2002, the GRACE satellite mission is aimed to monitor the time variations of the Earth gravity field. It provides high accuracy models of the Earth gravity field every 3-5 weeks. The Earth’s gravity field changes with time, following mass redistribution (1) in the outer fluid envelops and (2) in the solid Earth In particular, motion of the ground surface and of inner interfaces during an earthquake changes the gravity field in the vicinity of the epicenter.
Cumulative errors in geoid CHAMP : 7 yers GRACE : 5 years GOCE : 1 year GOCE
Model GGM02S based on 363 days of Grace measurements Gravity anomalies suing data of 10 years of satellite tracing
Temporal variations of the Earth gravity field mirror mass redistribution in the outer fluid envelops and inside the solid Earth. Most of the variability in the gravity results from the dynamics of the atmosphere, oceans, and land hydrological systems. Post-glacial rebound, tectonic, seismic and volcanic events also produce gravity variations, although of smaller magnitude. To extract geodynamic signals it is necessry to remove signals from atmosphere and fluid envelops.
For this study we used the following data bases: 1. GRACE monthly geoid anomalies provided by CNES [Biancale et al. 2005], spanning the period between August 2002 and September 2005. 2. Atmospheric models of the European Center for Medium-range Weather Forecast (ECMWF); 3. Model MOG2D (CNES “modèle 2D d'ondes de gravité”)for the ocean effect; 4. CNES FES-2004 model for correction for the ocean tides effect ; 5. Meteo-France ERA-40 reanalysis of the European CEP (Centre Européen de Production) model for correction for hydrology.
We started our study on geodynamical applications of satellite gravity data in 2003 using Chili-1960 and Alaska-1964 earthquakes as examples. “Can tectonic processes be recovered from new gravity satellite data?” V. Mikhailov, S. Tikhotsky, M. Diament, I. Panet, and V. Ballu, EPSL, v. 228, 2004, p. 281– 297
We considered three following gravity inverse problems: Problem 1: To check whether temporal variations of the geoid height contain a geodynamic signal from an earthquake. We concluded that using the technique we developed, gravity field variations similar to those caused by Alaska-1964 earthquake should be recognizable in GRACE data. The vertical movement of the Earth surface during the Alaska-1964 earthquake (contours are separated by 1000 mm). The solid rectangle is the projection of the fault plane on the surface. This fault plane corresponds to the model 3 by Savage and Hastie [1966]. Arrows shows the horizontal displacement at the surface. Maximum arrow length corresponds to the 6 m displacement.
Problem 2: To investigate if it is possible to discriminate among several possible fault plane models of an earthquake using satellite gravity data. We considered different fault plane models suggested for the Chile-1960 earthquake. We found that one can distinguish between these models with a probability approaching 70% at present level of GRACE accuracy. A comparison of three different fault plane models for the Chile-1960 earthquake [Plafker, Savage, 1970] along the latitudinal profile crossing the subduction zone. The amplitude of the Earth surface vertical displacement and the corresponding fault plane positions for the three possible models are shown.
Problem 3: To recognize geodynamic gravity signal caused by partly locked fragment of a subduction zone. We showed that if forthcoming gravity models are one order of magnitude more accurate compared to the first GRACE model then 5 years of data will allow recognition of time varying gravity signal associated with locked areas of the Alaska subduction zone. Vertical (isolines in mm/year) and horizontal (arrows) displacements at the surface in the vicinity of the locked area of Alaska subduction zone (Zweck et al., 2002). According to this model there are two locked asperities separated by the zone of a post-seismic slip. The maximal arrow length corresponds to 6 cm.
3 years of geoid variations from GRACE and LAGEOS data at 10-day intervals from July 2002 to March 2005 CNES/GRGS product Work with real data started in December 2005 thanks to our colleagues from CNES/GRGS (R. Biancale et al.) who delivered to the scientific community 86 GRACE and LAGEOS gravity field models expressed in normalized spherical harmonic coefficients from degree 2 to degree 50, which cover the period from July 29th, 2002 to August 24th, 2005. Therefore we could study both the December 2004 and March 2005 events. Note that monthly more complete models (up to harmonics 120) became available from US or German agencies in May 2006, but higher harmonics appeared to be strongly contaminated by noise.
A strong negative signal appeared after the earthquake over the Andaman Sea. Comparison of 2 geoid models covering one month period before (left) and after (right) the Andaman-Sumatra earthquake. December 2004 January 2005 Stripes are due to aliasing and definitely are errors. There are hydrology effects (for example in Amazonia)
Synthetic gravity signal for model (Benerjee et al., 2005). GRACE geoid signal Difference between January 2005 and December 2004 geoids. • A positive geoid signal in the area of the earthquake • A wide and stronger negative signal centered in the Andaman Sea.
Comparison of geodynamic gravity signal obtained using different staking intervals (from 1 to 9 months) demonstrates that the signal is robust. Data were corrected for hydrology.
GRACE Conclusions: • GRACE data are compatible with models built on GPS and seismological data. GRACE satellites show geoid anomaly in the Andaman Sea associated with the earthquake. • We suggest that part of the negative signal (only observed by gravity) could result from subsidence caused by the compressional stress release in southern Andaman back arc basin. • Time variations of gravity also appear to be a promising tool to reveal silent earthquakes (slow aseismic slip events) and for monitoring of locked asperities of subduction zones. • Indeed, Sumatra-2004 earthquake showed that areas of large stress accumulation and release can be recognized not only by narrow relatively weak positive geoid anomalies along trench, but also by wider and stronger anomalies in back-arc basins.