Download
1 / 35
350 likes | 517 Vues
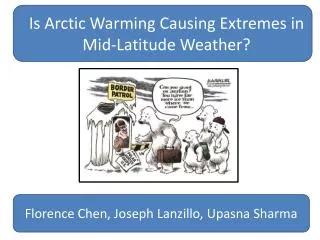
Is Arctic Warming Causing Extremes in Mid-Latitude Weather?. Florence Chen, Joseph Lanzillo , Upasna Sharma. Why is “Waviness” Important?. http://www.whitehouse.gov/photos-and-video/video/2014/01/08/polar-vortex-explained-2-minutes. Rossby Waves and the Jet Stream.

E N D
Is Arctic Warming Causing Extremes in Mid-Latitude Weather? Florence Chen, Joseph Lanzillo, Upasna Sharma
Why is “Waviness” Important? http://www.whitehouse.gov/photos-and-video/video/2014/01/08/polar-vortex-explained-2-minutes
Rossby Waves and the Jet Stream • The Jet stream: Westerly air current that separates cold, low pressure polar air from warmer high pressure air in mid-latitudes
Winds Associated with Rossby Waves https://www.youtube.com/watch?v=FNnIrIuNbeA
Outline: Francis & Vavrus believe AA causes mid-latitude extremes Arctic Amplification ? Decreased Thickness Gradients Decreased Zonal Wind Speed Increased Wave Amplitude Mid-Latitude Weather Extremes ? ?
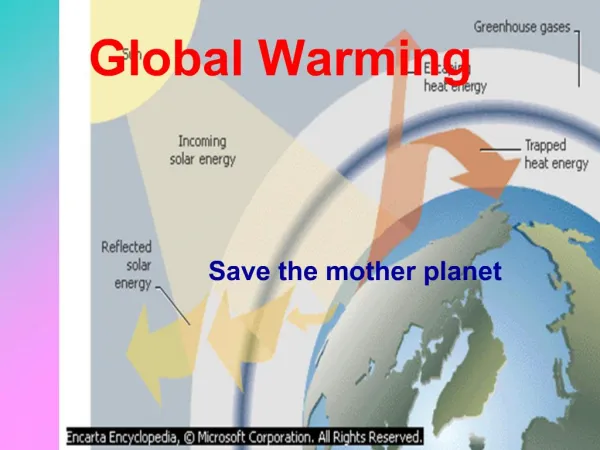
Defining Arctic Amplification Differential warming of the pole relative to lower latitudes: Twice as large rise in Arctic near-surface air temperatures compared to global average in recent decades • Driven by: Ice-albedo feedback, atmospheric H2O vapor content, increased greenhouse gases • Strongest in Fall and Winter • Potentially alters mid-latitude weather patterns Change in Annual Surface Temperature from 1958-2008 Source: http://jeb.biologists.org/content/213/6/855/F1.expansion.html
Z500 = 500 hPa Height Contour 500 hPa height = height at which pressure is 500 hPa Z500= daily mean height of 500 hPa contour
Defining the Thickness Gradient Thickness: vertical distance between two pressure surfaces at a given location PV=nRT P = pressure V = volume n = moles of gas R = gas constant T = temperature Thickness gradient: change in thickness between two locations
Recent Changes in Thickness Decreased thickness gradient leads to decreased temperature gradient
Increases in Amplitude caused by Thickness Changes Ridge North/South Elongation resulting from Arctic Amplification • Thickness gradient decreases • Rossby wave expands North/South to cover the same vertical height • Larger amplitude corresponds to slower westerlies Francis and Vavrus (2012)
AA Causes Weakened Zonal Winds Zonal latitudinal Zonal flowis generally west to east Geostrophic Balance
Outline of Francis and Vavrus (2012) • Methods • Thickness Anomalies • Amplitude Gridpoints = Number of Ridge Peaks above 50°N • Northward Movement of Gridpoints • Number of Gridpoints • Changes in Gridpoints with Time and Latitude • Zonal Wind • Decreases in 1000-500hPa Thickness • Decreases in Zonal Wind Speed Jennifer Francis, Rutgers Stephen Vavrus, U. Wisconsin-Madison
Francis and Vavrus(2012): Methods • Looked for mid-latitude patterns at 500 hPa height fields (NCEP/NCAR post-satellite data) • Assessed if changes in AA caused changes in atmospheric circulation • Investigated effects of high-latitude change on mid-latitude patterns at 500 hPa Red Asterisks are examples of selected range of 500 hPa heights used in analysis Regions: N. America and Atlantic Ocean basin
Measuring Zonal Thickness Anomalies Northern Hemisphere Thickness Anomalies from 40-90° N • Graph measures thickness between 500-1000 hPa • OND=Oct-Nov-Dec means • Anomalies seen in 2000-2010 mean thickness compared to 1970-1990 mean thickness • White spots: Statistically significant (95% confidence) anomalies *F and V do not specifically mention statistical test* Conclusion: Thickness anomalies apparent in areas that experienced warming North Pole
Northward Progression of Ridge Peaks Increase in Max. Latitude of Ridge Peaks 1979-2010 Lat. Conclusion: northward movement of peaks supports hypothesis that AA contributes to ridge elongation SeptSea Ice area (OND) Maximum latitude of daily wave peaks increasing – 99% confidence in trends Sea Ice Decreasing on reversed scale
Increased Wave Amplitude and Number of Ridge Peaks North of 50o N Increase in number of ridge peaks north of 50oN over past 30 years (Gridpoints/decade) (OND) Increase in wave amplitude (deg/decade) Red asterisks indicate significance at 90% confidence interval (Longitude °E) • Conclusion: support for hypothesis that there is now a larger number of bigger waves
Time/Longitude Variations in Gridpoints # of Peaks 4 44 84 125 165 205 °E 240 260 280 300 340 More gridpoints (darker red) indicates that more waves peak farther North than previously F&V conclusion: In 2010, more peaks occur North of 50° N than did in 1980, indicating increase in wave amplitude.
Decreased 1000-500 hPa Thickness Time Series of Seasonal 1000-500 hPa thickness differences between 80-60oN and 50-30oN • Why post-1980 data? • Rapid ice loss • Enhanced warming • Observed: ~10% decrease in poleward thickness differences. • Decrease especially during winter (OND) and fall(JAS, >95% confidence)
Zonal Speed of 500hPa Winds is Decreasing 500 hPa Zonal Wind Speed Change Over Time 14% decrease from 1979-2010 in OND wind speed (95% confidence) • Possible effects • Rossby wave slows • Amplitude increase? • Natural variability problem • Trend of steady decrease starting from 1990 • 20 years may not be enough to distinguish between “real” trends and variability Francis and Vavrus 2012
Outline: How Does Barnes question F and V? • Methods • SeaMinMax and DayMinMax • Z500, v250, and u500 • No North/South Wave Amplitude Change • Seasonal and Daily Method Comparison • Change in Elevation not Magnitude • No Trend in Maximum Wave Extent • Are Wind Speeds Changing? • Zonal Wind • Z500 Phase Speed • MeridionalWind Speed Elizabeth Barnes, Colorado State
Barnes et al. (2013): What are SeaMaxMin and DayMaxMin? • Used to calculate North-South geopotentialheight extents SeaMaxMin: Seasonal DayMaxMin: daily wave extent for single wave. s: Season d: Day λ: longitude Θ: various latitudes Examples of SeaMaxMin (left) and DayMaxMin (right) meridional wave extent metrics
Seasonal and Daily Wave Extents Are Not Increasing North/South Extent of Z500 Isopleths Conclusion: Trend detection sensitive to methodology, and no significant increase in wave extent Contrast with F and V’s conclusion: increase in North/South wave size “Large but nonsignificant” seasonal trend (two-sided t-test; 90% confidence) “Small, nonsignificant” daily trend
Compare U500, Z500 and v250 U500: monthly mean zonal wind speed at 500 hPa Z500: daily mean height of 500 hPa contour V250: mean daily North-south wind speed at 250 hPa
Elevation of the Jet Stream is Changing, not Magnitude! Elevation of 500 hPa surface (SeaMaxMin) based on longitude Latitude difference between time series Elevation difference between time series Since 1980, change in meridional extent and elevation of seasonal average 500 hPa level have been small BUT… Lat (oN)
Elevation of the Jet Stream is Changing, not Magnitude! Elevation of 500 hPa surface (DayMaxMin) based on longitude Latitude difference between time series Elevation difference between time series …Daily average 500 hPa layer has seen greater elevation change over time than Seasonal average Lat (oN)
Maximum Extent of Waves is Not Increasing Maximum North-South Extent of 500hPa Pressure (z500) • No significant trends in wave extents observed for any season • Significant slopes defined as differing from 0 at 90% confidence
Zonal Wind Speed Does Decrease – Agreement with F and V Trends in zonal wind speed between 30-70° N Change in zonal wind speed (m/s per decade) -3 independent data analyses shown -Circles indicate 95% confidence that trends are significant These trends confirm F & V (2012) argument that zonal wind speed is decreasing.
Z500 Phase Speed Is Not Decreasing Trends in Z500 Phase Speeds in Each Season Positive and nonsignificant phase speeds Barnes concludes: Relationship between Z500 and u500 is complex Contrast with F and V’s conclusion: Z500 Decrease in Fallis important because OND is key season Decrease in phase speed – different from 0 at 95% confidence
Meridional Wind Speed Not Decreasing when Viewed on 30-70N Latitude Range No significant trend in wave phase speeds in any reanalysis in any season. Daily Mean 250hPa meridional wind speed (c250, 30-70N) • Agreement in v250 and Z500 averaging (domain dependent) • Positive significant OND trends seen only when speeds averaged between 40oN and 60oN Seasonal trend of v250 phase speeds for Atlantic NA region
How does Wallace question F and V? Despite any extreme cold weather trends, global warming still prevails Arctic Warming Wallace claims this connection is too weak Mid-latitude weather Streamlines of 500 hPa winds – Jan 7, 2014 (Wallace et al. 2014)
Natural Variability Number of Runs Needed to Detect Significant Changes (Nmin) in Atmospheric Variables • Screen’s t-test model shows 50+ runs (years) needed to distinguish significant change (95% confidence) from atmospheric variability • Francis and Vavrus and Barnes include 30 year data sets Variables from Francis and Vavrus (2012) Variable from Barnes 2013 Screen et al. (2013)
Lag Between Ice Melt and Weather Extremes Despite some trends between Arctic warming and mid-latitude weather changes, one pattern is not explained by theory: Late summer decrease in sea ice Change in atmospheric circulation at mid latitudes in other seasons This observed lag contradicts theory of Francis and Vavrus
Thinner Sea Ice Doesn’t Always Mean Colder Winters • More severe cold air outbreaks in past when Arctic sea ice was thicker & more extensive • Longer time scales (50-100 yrs) show: < Rate at which low temperature records are being set Rate at which high temperature records are being set Conclusion: Longer time scales more indicative of future.
Implications for the Scientific Debate “The research linking summertime Arctic sea ice with wintertime climate over temperate latitudes deserves a fair hearing. But to make it the centerpiece of the public discourse on global warming is inappropriate and a distraction.” – Wallace et al. (2014) • Theory of “waviness” far from airtight and up for debate • We can still focus debate on the idea and its implications • Precautionary principle: we should act to prevent a potentially harmful result even if full scientific consensus does not exist
Key Considerations • Links between thickness gradient-amplitude and amplitude-zonal wind speed not well understood • Counting northern ridge points may not be effective measure of wave amplitude • Barnes does detect increases in N/S wave extent, decreases in zonal wind speed and decreases in Z500 phase speed • Important to consider natural variability and methods of measuring significance • We can and should discuss theories that are not fully substantiated