Download
1 / 4
40 likes | 231 Vues
1.) Describe the graph in terms of increasing/decreasing. 2.) On which interval is the graphed portion of the function increasing or decreasing? 3 .) What is the average rate of change from x = 4 to x = 7? 4 .) What is the average rate of change from x = -2 to x = 2?

E N D
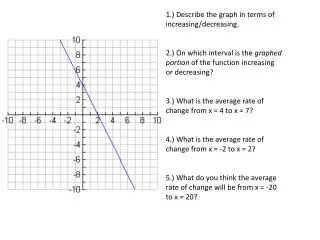
1.) Describe the graph in terms of increasing/decreasing. 2.) On which interval is the graphed portion of the function increasing or decreasing? 3.) What is the average rate of change from x = 4 to x = 7? 4.) What is the average rate of change from x = -2 to x = 2? 5.) What do you think the average rate of change will be from x = -20 to x = 20?
1.) Describe the graph in terms of increasing/decreasing. 2.) On which interval is the graphed portion of the function increasing and/or decreasing? Use proper interval notation. 3.) What is the average rate of change from x = 1 to x = 2? 4.) What is the average rate of change from x = 1 to x = 3? 5.) What do you think the average rate of change will be from x = -4 to x = 4?
1.) Describe the graph in terms of increasing/decreasing. 2.) On which interval or intervals is the graphed portion of the function increasing and/or decreasing? Use proper interval notation. 3.) What is the average rate of change from x = -2 to x = 1? 4.) What is the average rate of change from x = 1 to x = 2? 5.) What do you think the average rate of change will be from x = -3 to x = 2?
1.) Describe the graph in terms of increasing/decreasing. 2.) On which interval or intervals is the graphed portion of the function increasing and/or decreasing? Use proper interval notation. 3.) What is the average rate of change from x = -7 to x = 0? 4.) What is the average rate of change from x = -7 to x = 5? 5.) What is the average rate of change from x = -7 to x = 10?