Download

1 / 23
230 likes | 439 Vues
10 th May 2007, EWEC Milan. Towards Quantification of Condition Monitoring Benefit for Wind Turbine Generators. Mr. David McMillan (Presenting) and Dr. Graham W. Ault. Summary:. Evaluate and quantify condition monitoring system benefit for wind turbines via probabilistic simulation.

E N D
10th May 2007, EWEC Milan Towards Quantification of Condition Monitoring Benefit for Wind Turbine Generators Mr. David McMillan (Presenting) and Dr. Graham W. Ault Summary: Evaluate and quantify condition monitoring system benefit for wind turbines via probabilistic simulation
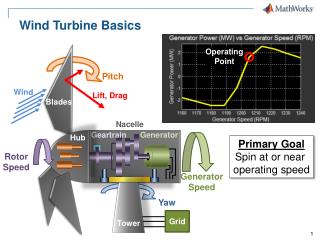
Trends in Wind Capacity: UK focus • Barriers to employment of condition based maintenance (CBM) for Wind Turbine Generators (WTGs) • Forming an Economic case for Wind Turbine CM systems • Modelling and Analysis to Quantify WTG CM Benefit • Results, Conclusions and Discussion Overview of this Morning’s Presentation
WHY? Trends in Wind Capacity and Condition Monitoring • Renewables Obligation fuelling rapid build of Wind Capacity in the UK • Over 10GW (>10%) of capacity in the UK planning system alone … Until 2027 • Turbines increasingly installed with a Condition Monitoring (CM) system • … However, utilities are reluctant to move towards condition - based maintenance of wind farms.
An assumption that the simplest methods will serve best • - Hence use of scheduled (periodic) maintenance Periodic Maintenance Reactive Maintenance Time Possible Reasons Against Employment of CBM • The low technical impact of a single wind turbine outage • The low economic yield of WT– relative to fossil fueled plant
- Interpretation: Pay a team of experts or rely on automation Well-known practical difficulties with CM • - Transducers (Mounting, Spurious Signals, Reliability)
Motivation: The Economic Case for CM • Fact: Wind farm operators will only move towards widespread use of CM systems if the economic case for their use is clear. • … So answers to the following questions would be useful: • 1. What is the value of a wind turbine condition monitoring system? • 2. Are CM systems currently cost-effective? • 3. What are the necessary conditions for cost-effective WTG CM? • Build a set of models to answer these questions.
Yield, cost, revenue, spares, operational life & maintenance objectives Tested asset management policies Asset Management & High-Level Objectives Model Power Performance Evaluation Model Wind Regime, Turbine Power Curve, Turbine and Market Economics Evaluated via Wind Turbine performance Turbine condition states, Turbine component reliability Condition Model Markov Chain Solved via Monte Carlo Sim. Quantified: Availability, Reliability & Condition The ‘Component’ Model Modelling Approach Summary
1. Wind Turbine Sub-Component Reliability Data • 2. Wind Farm Operational Experience • Sub-Component Reliability Data: Failures [1] G.J.W. van Bussel et al, Reliability, Availability and Maintenance aspects of large-scale offshore wind farms, MAREC01, [2] P.J. Tavner et al, Machine and Converter Reliabilities in Wind Turbines, PEMD 06, [3] H. Braam et al, Models to Analyse Operation and Maintenance Aspects of Offshore Wind Farms, ECN Modelled Components • Two sources of information to decide which components to model:
Generator • Gearbox • - High Capital Cost • Long Lead Time • In-Situ Repair Difficult • Large Size/ Weight - Position: in Nacelle, at the top of the tower Operational Experience • - What about the severity of the failure: cost, downtime etc? • The published data focuses primarily on annual failure rate • Dialogue with WT operators reveals the most severe failures:
Generator Annual Turbine Failure Rate = 2.1 Vibration Lube Oil Analysis Temperature Blade Blade 0.1 Optical Strain Electronics 0.46 Generator 0.28 Gearbox 1.25 Gearbox Input Values Vibration Lube Oil Analysis Power Electronics Temperature No Monitoring Model Development: Selected Components and Monitoring
Useful Features of this Modelling Framework • Flexible approach: easily add new features • Able to model Condition Monitoring (knowledge of states) • Probabilistic nature can take account of future uncertainties • A recognised method for equipment degradation modelling • Easily interfaced with other models • Multi-stage model can capture time dependence WT Component Modelling Technique Model wind turbine as a deteriorating system of sub-components • Method: Discrete-time Markov chain solved via Monte Carlo simulation
17 27 C1 U C1 U 23 C1 D C2 U C2 D C2 U C3 U C3 U C3 U C4 D C4 DER C4 DER 19 C1 U 11 C1 DER 5 10 12 18 C1 U C1 U C1 DER C1 U C2 DER C2 U C2 U C2 U C2 U C2 DER C3 U C3 D C3 U C3 D C3 D C3 U C4 D C4 U C4 DER C4 DER C4 D C4 U 6 14 13 7 2 1 3 C1 U C1 U C1 DER C1 DER C1 DER C1 U C1 U C2 DER C2 DER C2 DER C2 U C2 U C2 U C2 U C3 U C3 U C3 D C3 U C3 U C3 U C3 D 9 C1 U C4 DER C4 DER C4 DER C4 DER C4 U C4 U C4 U C2 U C3 D C4 U 21 4 25 C1 D C1 DER C1 U C2 U C2 DER C2 D C3 U C3 U C3 U 15 C1 DER C4 U C4 U C4 U C2 DER C3 D 26 C4 U C1 DER 22 C1 D C2 D C2 DER C3 U C3 U C4 U C4 U 8 16 C1 DER C1 DER 24 C2 DER C2 DER 28 C1 D C1 DER C3 D C3 U C2 DER C2 D C4 DER C4 DER C3 U C3 U C4 DER C4 DER 20 C1 DER C2 DER C3 U C4 D State Space of 4-Component Model
Yield, cost, revenue, spares, operational life & maintenance objectives Tested asset management policies Asset Management & High-Level Objectives Model Power Performance Evaluation Model Wind Regime, Turbine Power Curve, Turbine and Market Economics Evaluated via Wind Turbine performance Turbine condition states, Turbine component reliability Condition Model Markov Chain Solved via Monte Carlo Sim. Quantified: Availability, Reliability & Condition The Power Performance Evaluation Model Modelling Approach Summary
Turbine Curve Model Wind Speed Model Yearly site wind speed data used to form probability distribution Sampled from manufacturers data sheet Wind speed is generated by randomly sampling this distribution This is fed into the turbine curve model Revenue Calculation Market Price Electricity = £36/MWh Market Price ROCs = £40/MWh Wind Turbine Yield Model
Yield, cost, revenue, spares, operational life & maintenance objectives Tested asset management policies Asset Management & High-Level Objectives Model Power Performance Evaluation Model Wind Regime, Turbine Power Curve, Turbine and Market Economics Evaluated via Wind Turbine performance Turbine condition states, Turbine component reliability Condition Model Markov Chain Solved via Monte Carlo Sim. Quantified: Availability, Reliability & Condition The Asset Management Model Modelling Approach Summary
1. Scheduled 6-Month Maintenance 2. Condition Based Maintenance Maintain at set intervals (current practice) Maintain at intervals informed via condition information Maintenance Frequency Replacement and Repair Costs These costs are subtracted from the turbine revenue stream Maintenance Models
Weather Constraints Other conditions such as lightning or snowfall also prohibitive.
Use concept of operating risk as decision-metric: • Im(event) = Economic term(s), currently replacement cost of component CBM Maintenance Regime • Condition-Based decision model: couple condition & maintenance
The risk magnitude sets the level of maintenance urgency via delay time • Condition and Maintenance are now Linked Risk Magnitude Informing Maintenance Intervals • Risk associated with each model state
@ 95% degree of confidence, Z score =1.65 Electronics 0.43 Blade 0.07 Generator 0.21 Gearbox 1.31 Simulation Study for CM Evaluation These concepts were coded in Fortran 95 Multiple runs of the program were conducted: Average values and confidence limits calculated: The following metrics were produced for a periodic maintenance policy:
Maintenance Comparison: Periodic Vs. CBM • Simulation resolution is 1 day • Simulation run 30 times, for 14,000 trials
The model outputs can provide ballpark figures but the assumptions must be valid! … But how is value of CM affected by different operating conditions? Implications for Future Research • Test model for different conditions: wind regime, turbine ratings etc. • Model reliability of condition monitoring system itself • Less assumptions, better characterisation of actual processes Conclusions • It appears possible to quantify the benefits of WTG CM via modelling • CBM annual value of £2,000: borderline cost-effective
Towards Quantification of Condition Monitoring Benefit for Wind Turbine Generators Mr David McMillan and Dr. Graham W. Ault E-mail: dmcmillan@eee.strath.ac.uk Many thanks to Yusuf Patel at Scottish Power and Peter Diver at ITI Energy. This research was conducted under the PROSEN project, EPSRC grant number EP/C014790/1.