Download
1 / 1
10 likes | 149 Vues
EG 10/31/06 v6. BIDMC Dyssynchrony Echo Worksheet. Last, First: ______________________________ BIDMC#_________________ Echo Date:_______________. QRS Duration on last ECG: ( ) < 120 msec ( ) 120-149 msec ( ) > 150 msec Indication: ( ) Pre-CRT ( ) Post-CRT / Optimization.

E N D
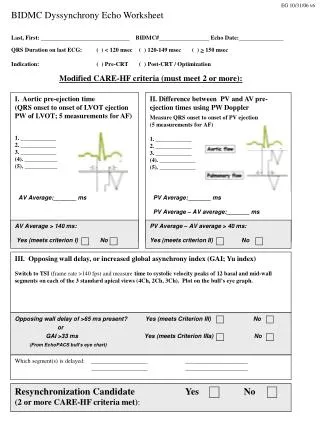
EG 10/31/06 v6 BIDMC Dyssynchrony Echo Worksheet Last, First: ______________________________ BIDMC#_________________ Echo Date:_______________ QRS Duration on last ECG: ( ) < 120 msec ( ) 120-149 msec ( ) > 150 msec Indication: ( ) Pre-CRT ( ) Post-CRT / Optimization Modified CARE-HF criteria (must meet 2 or more): I. Aortic pre-ejection time (QRS onset to onset of LVOT ejection PW of LVOT; 5 measurements for AF) 1. ____________ 2. ____________ 3. ____________ (4). ___________ (5). ___________ II. Difference between PV and AV pre-ejection times using PW Doppler Measure QRS onset to onset of PV ejection (5 measurements for AF) 1. ____________ 2. ____________ 3. ____________ (4). ____________ (5). ____________ AV Average:_______ ms PV Average:_______ ms PV Average – AV average:_______ ms AV Average > 140 ms: Yes (meets criterion I) No PV Average – AV average > 40 ms: Yes (meets criterion II) No III. Opposing wall delay, or increased global asynchrony index (GAI; Yu index)Switch to TSI (frame rate >140 fps) and measure time to systolic velocity peaks of 12 basal and mid-wall segments on each of the 3 standard apical views (4Ch, 2Ch, 3Ch). Plot on the bull’s eye graph. Opposing wall delay of >65 ms present? Yes (meets Criterion III) No or GAI >33 ms Yes (meets Criterion IIIa) No(From EchoPACS bull’s eye chart) Which segment(s) is delayed: ___________________ _____________________ ___________________ _____________________ Resynchronization Candidate Yes No (2 or more CARE-HF criteria met):