Download
1 / 66
660 likes | 991 Vues
Milestones in Pediatric Nutrition. Dr Justine Turner Department of Gastroenterology & Nutrition Stollery Children’s Hospital. Objectives. Understand nutritional milestones through infancy, childhood and adolescence

E N D
Milestones in Pediatric Nutrition Dr Justine Turner Department of Gastroenterology & Nutrition Stollery Children’s Hospital
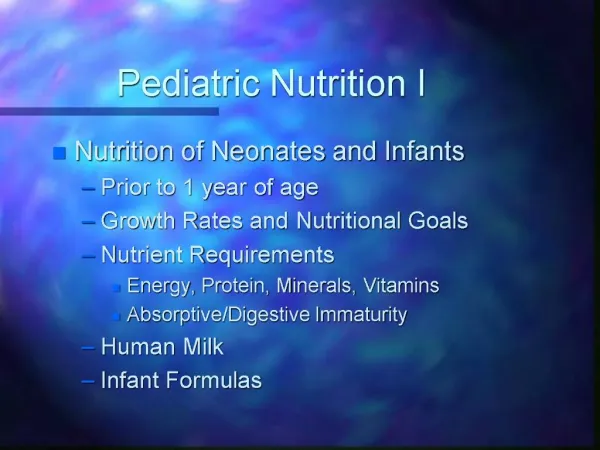
Objectives • Understand nutritional milestones through infancy, childhood and adolescence • Understand the implications of abnormal nutrition during each of these life stages • Understand how we monitor nutrition in infants, children and adolescents
Principles of Pediatric Nutrition “Growth & Development” Total Energy Requirements = Maintenance + Growth Requirements + Physical Activity
So that in addition to energy requirements for maintenance:Which is the turnover of normal body tissues that is dependent upon body size, composition and under the influence of climate and disease statesThere is the requirement for growth-maximal in infancy esp first six months and in pubertyBasis of DRIThere are also developmental changes which influence requirements by changing body composition and also through change in the functional capacity of organs for example preterm infants compared to older infants
Principles of Pediatric Nutrition “Normal Growth” 2% 50% 98% Percentile Rank
Change in Proportions Compared to an adult a newborn has a larger head in proportion to the rest of its body, with a rounder face and chest and more prominent abdomen also seen throughout early childhood. The new born also has relatively short extremities and the bodies midpoint is roughly at the level of the umbilicus.
Female Adulthood Relative Fatness Male Birth Relative Lean mass Gender Differences in Body Composition Development During puberty women develop greater body fat stores and store more calcium in bone corrected for smaller bone size
Embryonic period is the first 12 weeks during which time organogenesis is complete and a fetus emerges looking roughly like a human infant The fetal period between 12 – 40 weeks is a period of rapid growth and differentiation of organ function so that by 24 weeks the fetus is viable Maximal growth occurs from 32-38 weeks, in which time the weight of the fetus doubles The placenta supplies all the nutrient needs of the fetus for growth and grows with the fetus until 36 weeks 24-42 weeks of gestation are critical times for brain development when the developing fetus is susceptible to nutritional insults that can have lasting cognitive defects; so its not surprising that infants with IUGR have a 15% rate of minor neuro-developmental abnormalities The developing brain is quite plastic so there is a critical period when re-nutrition can reverse cognitive defects and this is probably in the first 18 months of life – highlighting why infancy defined as the first two years following birth is a critical period for optimal nutrition
Fetal & Maternal Nutrition • Fetus dependent on maternal blood supply & placental function • Nutrient transport varies during gestation • Negative impact of maternal diseases (heart disease, hypertension, diabetes) and smoking • Special nutrient roles eg folic acid • Maternal nutrition major determinant of fetal size at birth
Primary nutrient providing the energy for growth throughout pregnancy is glucose; also a steady supply of amino acids, small supply of some intact proteins like immunoglobulins and essential fatty acids both predominantly later in pregnancy. The last three months of pregnancy are also the principal time for transport of iron and calcium to the fetus. In fact during the third timester of pregnancy the concentration of calcium in the fetus is greater then in the maternal plasma implying active transport of calcium occurs across the placenta. • Folic acid is critically important for DNA synthesis and cell proliferation and folate requirements during gestation are 5-10x those in non-pregnant women; deficiency associated with SGA and preterm birth and neural tube deficits • In addition to nutrients the placenta supplies the fetus with hormones, growth factors, immunoglobulins and other immunoactive factors. • In women with good nutrition there own body size, genetically determined, is correlated with fetal size and is difficult to show that diet during pregnancy influences fetal size independently • but in women at risk of poor nutrition it can be clearly shown that dietary supplementation increases fetal size • In addition poor nutrition or low BMI in women is associated with increased risk of toxemia (effects placental function) and preterm birth preterm birth and IUGR
Challenges for the Preterm Infant • Increased water requirement • Decreased subcutaneous fat • Increased hypoglycemia • Decreased energy reserves • Immature feeding / nutrition support • Risk of metabolic bone disease / iron deficiency • Increased risk of infection • Long term effect on growth and intellect
Ideal Infant Nutrition:Breast milk • Supplies all nutrient requirements for infants 4 - 6 months of age • Given adequate fetal stores and sunshine • WHO recommends exclusive breast feeding for the first 6 months of life, continued up to 2 years • Perfectly packaged / sterile / warm / cheap • Psycho-social-emotional benefits
Preventing Child Mortality Lancet 2003
Special Benefits • Infection • Immunoglobulins (sIgA); lactoferrin; lytic enzymes; glycopeptides that stimulate bifidobacteria; leucocytes / cytokines / antioxidants… • Absorption and metabolism • Bile salt stimulated lipase; amylase; lactoferrin; lactalbumin; folate binding protein • Development • Growth factors • Allergy • Disease
Consider that the newborn infant is in a postnatal state of development that breast milk is specifically designed to compensate and enhance • Best example is that in the absence of breast feeding neonates have an acquired immunodeficiency state some of the ways in which breast feeding compensate for this immunodeficiency include: • Immunoglobulins, mainly sIgA • Direct inhibitors of bacteria like lactoferrin that inhibits bacterial growth by competing for iron and lytic enzymes that breastkdonw bacterial cell walls • Glycopeptides and proteins that promote the growth of nonpathogenic bacteria in the infants bowel – to in turn inhibit pathogenic bacteria • A host of other immune active and antiinflammatory substances • Breast milk also enhances gut development and compensates for those aspects of GI function that are not fully developed • Eg. Bile salt-stimulated lipase aids in digestion of lipids in newborns (especially preterm infants) that have low lipase activity • Amylase from breast milk may compensate for low salivary and pancreatic amylase activity when complimentary feeds become introduced • Lactoferrin facilitate the uptake of iron; lactalbumin facilitate the uptake of calcium and zinc absorption; FBP folate uptake • CMPA is the most common gastrointestinal food allergy in infants with a prevalence of up to 8%, but only seen in % of exclusively breast fed infants. Breast feeding may not only reduce the incidence of CMPA but also later onset atopic diseases like eczema and asthma. • Breast feeding also seems to be protective of some other diseases like type I diabetes, IBD and some childhood cancers.
Other Possible Benefits • Brain • Breast fed infants have IQ advantage! • Observational studies; cofounders; however dose dependent! • Essential polyunsaturated fatty acids enhance neuronal structure, function and myelination • Benefit retinal and cognitive development in preterm infants • Obesity • Same methodological issues; consensus small protective effect (4% reduction in risk per month breast fed)
… also for the Preterm Infant • Reduced incidence of necrotizing enterocolitis and infections But… • Sick preterm / LBW infants unable to breast feed • Inadequate supply of vitamins and minerals for VLBW infants
We have already talked about the neurodevelopmental advantage of breast milk for preterm infants • NEC – a hemorrhagic necrotizing inflammation of the small intestine and colon - is a major cause of morbidity in preterm infants and there is level A evidence to show that breast milk is protective against NEC in preterm infants. In a semi- randomized trial in the UK formula was associated with a 6.5x increase risk of NEC compared to human milk feeding • Human milk fed infants experience nearly half the number of documented infections while in NICU then formula fed infants • The metabolic bone disease of prematurity occurs primarily because of inadequate stores of calcium and phosphorous in the preterm infant and will occur at increased incidence in exclusively breast fed VLBW premature infants – weighing < 1500 gm - without mineral supplementation: 30-50% • This has led to the development of fortified human milk for VLBW which have been shown to increase gains in weight, length and head circumference and bone mineral content
Moving onto Solids • Failure to introduce by 6 months leads to energy and micronutrient deficiency • Iron and zinc in particular • Teeth not essential to start • Primary teeth 5-9 months
Iron Deficiency • Greatest risk for infants as milk is replaced by semisolid food during weaning & adolescent girls • Impacts brain development • Neuronal cells particularly sensitive to iron deficiency during differentiation • RCTs show iron supplementation improves cognitive performance in school aged children, particularly those with iron deficiency • Numerous clinical studies show cognitive delays not reversible with subsequent iron therapy • Importance of prevention with iron fortification weaning foods and timely introduction of solids
6-18 month olds, also a critical time for brain development • At least one mechanism for this seems to be the sensitivity of neuronal cells… • Prolonged formula intake a particular problem as iron absorption poor compared to breast milk and also can have cows milk protein allergy with occult blood loss
Growth Milestones • Infancy Phase (up to 2-3 years) • Double birth weight by 5 months (20-30gm/d); triple birth weight by 1 year (8-12gm/d) • Length gain ~ 25cm year 1; ~12cm year 2 • Head circ. gain ~12cm year 1; ~5cm year 2; 1cm / year • Correct preterm birth up to 4 years • Childhood Phase • Weight ~ 0.5-1kg / year • Length ~ 5-6cm / year • More weight gain and earlier peak weight & height girls • Adolescent Phase
Growth should be monitored sequentially and is an important tool in the early detection of chronic disease in children; growth failure can often be the initial or only manifestation of underlying chronic disease eg IBD • Measurement of head circumference is important in the infancy phase as it is an indicator of brain growth – the brain doubles its weight by 12 months; head circumference is the last measure to be effected by malnutrition and is the least sensitive measure of growth but is reflective of brain development. • Adolescent phase where there is more variability depending also on timing puberty milestones we will talk about next
Failure to Thrive • Poor growth in infants and children • Decrease in percentiles over time • Cross-sectional low weight for height • Wasting (decreased MUAC) • 70% nonorganic and 50% organic • Classify causes: • Inadequate energy • Energy loss • Failure to utilize energy
Anthropometrics Assessing growth and nutrition by measurement of the dimensions of the body / parts of it
Decreased weight for age implies wasting • Deceased weight for height implies wasting • Decreased height for ageimplies stunting • Decreased weight and height may be normal • Head circumference usually spared
Other Anthropometric Definitions • %Ideal body weight • Moore: IBW at same percentile as height for age • McLaren: calculate age that height is on 50th percentile and weight for that age is IBW; assumes weight to height ratio is constant at all ages • BMI • Advantage over %IBW as independent of height and correlated with adiposity and low BMI with mortality
Which 12 year old boy has FTT? Boy with crohns disease - green
Which 16 year old girl is at greater risk of malnutrition? Green – AN, got fat then stopped eatining
The Problem with References • Population specific • Breast fed infants vs formula fed infants • Over diagnosis of under nutrition • Secular trends in the reference population • Arbitrary cut-off points • Cross sectional measurements • Crossing percentiles during infancy and adolescence can be normal
Obesity • Nutritional disorder of epidemic proportions • In obesity research no study has identified an absence of association between childhood and adult obesity • Obese children 3-5 years are 4.7x likely to become obese adults • Obese children 6-9 years are 8.8x likely to become obese adults • Obese children 10-14 years are 22.3x likely to become obese adults • Increasing age and BMI strengthen the association
Body Mass Index • BMI=weight (kg) / [height (m)]2 • BMI varies by age and sex • BMI Cut offs: • Risk of overweight: BMI > 25 (85-95%ile) • Overweight/Obese: BMI > 30 (> 95%ile) • BMI is not a measure of adiposity • Waist circumference better predictor of poor health outcome then BMI
BMI Difference NHES III vs NHANES III Males Females (Flegal International Journal of Obesity 2000)
Risks of Adult Obesity • Coronary Heart Disease • Stroke • Hypertension • Type II Diabetes • Increased total cholesterol, LDL, TG • Cancers • Gallbladder disease • Non-Alcoholic-Steato-Hepatitis • Orthopedic problems • Obstructive sleep apnoea
Risks of Childhood Obesity • Decreased self esteem, quality of life & SES • Orthopedic problems • Type II Diabetes • Hypertension • Increased total cholesterol, LDL, TG • NASH • Early atherosclerosis • Adult Mortality
Carb Pro Fat Energy Store Energy Input Energy Output REE TEF AEE Cause of Obesity:Imbalance in the Energy Equation
Interventions to Consider • Promote breastfeeding • Promote the healthy school lunch • Promote breakfast • Reduce TV snacking • Reduce sweetened beverage intake • Reduce total energy intake • Increase physical activity
Reducing Children's Television Viewing to Prevent Obesity A Randomised Controlled Trial Robinson JAMA 1999
Study Design • Subjects: 227 students, two schools • Intervention: • lessons on how to budget view time • TV turn off • electronic TV time manager