Download
1 / 20
200 likes | 376 Vues
Modeling Applications: Risk Management of Water Resources. Hydro and Agro Informatics Institute Ministry of Science and Technology. Content. Internet GIS Implementation Case Study. Development of GIS-MIS. GIS-MIS V.1.0. GIS-MIS V.1.1. GIS-MIS V.1.2. XMLParser. SVG files

E N D
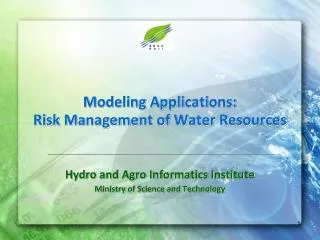
Modeling Applications: Risk Management of Water Resources Hydro and Agro Informatics Institute Ministry of Science and Technology
Content • Internet GIS • Implementation • Case Study
Development of GIS-MIS GIS-MIS V.1.0 GIS-MIS V.1.1 GIS-MIS V.1.2 XMLParser • SVG files • Z profiles • Control table • support pyramid • model • Generate IGIS GUI • SVG files • Z profiles • Basic control • table • IGIS GUI • SVG files • Z profiles Spatial Functions • Simplify • GeomUnion • (Time-D) • Other spatial • operators • Simplify • GeomUnion • (Time-D) • Simplify Image slicer • Level 1 • Many images • (one time) • Level 1 • Level 1 • Many images • (one time) • Other levels Internet GIS • Display z values • Area with height • calculation • Display Time-D • Wikipedia • Display z values • Area calculation • Time-D Prototype • Display z values 2006 2007 2008
SVG File SVG File SVG File XML Parser XML Parser Web Server Web Server HAII Officer HAII Officer HAII HAII DB DB PostgreSQL PostgreSQL • • IGIS IGIS GIS GIS Database Database • • Back Office Back Office xx xx … … x x .. .. xxxx xxxx … … xx xx xxxxxxxxxxx xxxxxxxxxxx xx xx … … x x .. .. xxxx xxxx … … xx xx xxxxxxxxxxx xxxxxxxxxxx xx xx … … x x .. .. xxxx xxxx … … xx xx xxxxxxxxxxx xxxxxxxxxxx xx xx … … x x .. .. xxxx xxxx … … xx xx xxxxxxxxxxx xxxxxxxxxxx DB xx xx … … x x .. .. xxxx xxxx … … xx xx xxxxxxxxxxx xxxxxxxxxxx xx xx … … x x .. .. xxxx xxxx … … xx xx xxxxxxxxxxx xxxxxxxxxxx xx xx … … x x .. .. xxxx xxxx … … xx xx MYSQL xxxxxxxxxxx xxxxxxxxxxx User User xx xx … … x x .. .. xxxx xxxx … … xx xx Project Database xxxxxxxxxxx xxxxxxxxxxx Reports Reports MIS MIS & & IGIS IGIS Internet GIS at HAII
Rainfall, collected rain water, and their variability Annual rainfall statistics of 2002, 2005-2008
The distribution of annual rainfall averaged from 1950 to 1997 Flood and Drought Map in 2006
Dok Krai Reservoir Eastcoast Gulf basin 15 areas 6 4 3 2 15 12 13 8 Nong Pla Lai Reservoir Klong Yai Reservoir Prasae Reservoir Bang Pra Reservoir 11 9 10 14 5 1 7 Gulf of Thailand
Water Balance Model Monthly precipitation (Pi) Upstream inflow (Upi) Runoff Model Runoff (Ri) Runoff (Ri) Supply (Si = Ri + Upi) Supply (Si = Ri) Irrigated area Unirrigated area Monthly Water Demand (Di) Monthly Water Demand (Di) Si – Di Si – Di Surplus Surplus Deficit Deficit Storage Sti=(Qini–Qouti)–Sti-1 Qini=0.3(Si–Di) Qouti Qini Balance Bi=Si–Di Balance Bi=(Si+Qouti)-Di Balance Bi=Si–Di–Qini Balance Bi = Si–Di Unirrigated area Downstream Outflow (Dni)
Dok Krai Reservoir Monthly water balance for irrigated area above Klong Yai Reservoir • Balance= Supply – Demand • Analyze risks based on Magnitudeof droughts & floods (Mm3) for all water situations • - Wet years • - Normal years • - Dry years Wet year 2006 Normal year 2007 Dry year 2004 April - March 6 4 3 2 15 12 13 8 Nong Pla Lai Reservoir Klong Yai Reservoir Prasae Reservoir Bang Pra Reservoir 11 9 10 14 5 1 7 Gulf of Thailand
Risk Analysis for Drought and Flood • 4 Study Areas • Chee River Basin • Lower Northern Basin • Mekong Basin • Eastern Coast Basin
Highest Risk Very High Risk High Risk Risk Analysis for Drought and Flood Chee River Basin Flooding Area Drought Area Highest Risk Very High Risk High Risk
Highest Priority Very High Priority High Priority List the areas in order of priority Chee River Basin
Area-Based Policy for Risk Mitigation • Area-Based Measures • Reservoir Network • Capacity Increase • New Reservoirs • Distribution Improvment • Water Diversion • Farm Ponds • Headwater Conservation • Agricultural Calendar • Community-Based Management • Natural Water Resource Improvement • Collaborative Teamwork • Water Education • Information System Development Chee River Basin
Risk assessment from monthly water balancefor Eastcoast Gulf basin Flood risk mapDrought risk map
Policy-based priority map for water managementof Eastcoast Gulf basin
Management to cope with variability in space & time Macro-management Micro-management Lean Management Risk Management
Highest Risk Very High Risk High Risk Risk maps of other basins Example flood risk maps Chi River Basin, NE Thailand Lower north basin • Lower chi river & area where tributaries meet have highest flood risks. • Lower Ping, Wang, Yom, and Nan basins have highest flood risks 18
Highest Risk Very High Risk High Risk Risk maps of other basins Example drought risk maps Chee River Basin, NE Thailand Lower Northern basin • Area above Ubonrat dam & middle Chi basin have highest drought risks • Lower Wang, middle & lower Yom, lower Ping, Nam Pak, Kwae Noi river have highest drought risks 19
Risk maps of other basins Example priority ranking maps Chee River Basin, NE Thailand Lower Northern basin Highest Priority Very High Priority High Priority 20