Download
1 / 23
230 likes | 360 Vues
This paper explores distributed ecohydrological modeling and its implications for water resource management, focusing on the interactions between biogeochemical cycling and watershed characteristics. Key processes such as carbon and nutrient cycling, hydrologic flowpaths, and the impacts of anthropogenic activities are examined. The study emphasizes the importance of considering spatial heterogeneity and long-term feedbacks in ecosystem models to accurately assess nutrient loading and water quality. Special attention is given to the role of riparian zones in controlling pollutant movement and enhancing watershed health.

E N D
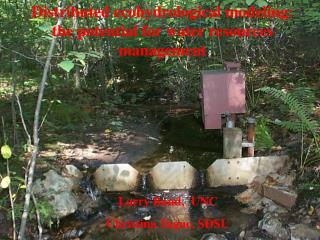
Distributed ecohydrological modeling: the potential for water resources management Larry Band, UNC Christina Tague, SDSU
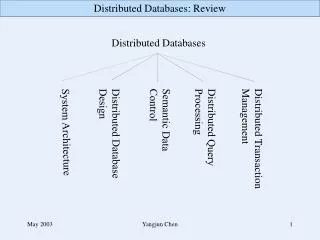
Characteristics of watersheds regulating biogeochemical cycling and export • In situ cycling of carbon and nutrients • Ecosystem Processes: deposition/fixation, assimilation, uptake, decomposition, mineralization, nitrification, immobilization, denitrification, and all that…. • Transport within hydrologic flowpaths • Hydrologic Processes: overland flow, shallow throughflow, groundwater flow,…. • Distribution of net source/sink strength along flowpaths
Plot based ecosystem models • water, carbon, nutrient flux computed in 1-d • long time step (one day to one month) • long time domain (decades to centuries) incorporating long term feedbacks to ecosystem state • typically run without consideration of spatial heterogeneity • no incorporation of spatial dependency along flowpaths
Nitrogen saturation hypothesis: • Definition: Terrestrial ecosystems have a maximum rate of nitrogen uptake determined by the net ecosystem productivity and other (plot) N sinks, input exceeding this rate may leach to ... • Streamwater chemistry diagnostics: • ecosystem saturation stage diagnosed by streamwater chemistry, particularly in growing season • Based on plot paradigm: assumes leaching below rooting zone is contributed directly to streams
Watershed model: • e.g. HSPF - works well for discharge based on land use • also typically fix nutrient loading from land surface classes • lumped models cannot address downslope divergence (variable nutrient source/sink strength along flowpaths) • adjust for BMPs with reduction factor • no feedback to ecosystem processes controlling source quality
Baltimore Ecosystem Study: Urban LTER Oregon Ridge
Characteristics of watersheds regulating biogeochemical cycling and export:anthropogenic alteration • direct addition or abstraction of material • irrigation, fertilization, spills • wastewater treatment and disposal • alteration of hydrologic flowpaths • impermeable surfaces • street drainage • storm and sanitary sewers • vegetation management
RIPARIAN ZONES • Critical interface between terrestrial and aquatic components of a watershed. • Demonstrated ability to prevent pollutant movement from upland land uses into streams. • Most work on groundwater nitrate, in agricultural watersheds.
Denitrification NO3- NO2- NO N2O N2 - Anaerobic - Heterotrophic (requires organic C) • Expect high rates in wetland soils. • Key component of the water quality maintenance function of riparian zones.
Major carbon flux processes: patch level • Photosynthesis: Farquhar algorithm combining conductance and enzymatic limitations • Stomatal physiology: Conductance uses Jarvis method f(temp, LWP, PAR, VPD) • Respiration: Organ (foliage, root, stem) specific rates (massC/massC) modified by temperature Q10 • Allocation: Root, stem, foliar allocation of net photosynthate determined by Waring/Landsberg function on water, nutrient stress, and carbon supply • Litter decomposition: litter/soil moisture, T, quality determines rates from different soil pools
Nitrate export from Pond Branch: Note large increase in concentrations during summer - partially derived from riparian zones
Denitrification rates during summer and winter for hillslope 1
NO3 export concentrations as f(hydrology) • riparian patches typically near saturation, anaerobic, active denitrifying zones • significant reduction of [NO3] from upslope • low decomposition, accumulates carbon, nutrient rich material • during dry-downs riparian patches • may disconnect from uplands, WFPS drops • become aerobic, strongly nitrify • flip from sink to source of NO3 • note: growing season NO3 export not related to catchment nitrogen saturation