Download
1 / 56
560 likes | 697 Vues
Automatic Generation of Parameter Inputs and Visualization of Model Outputs for AGNPS using GIS. E. Lynn Usery Michael P. Finn. USGS DoD Environmental Program Conference. usery@usgs.gov mfinn@usgs.gov. http://mcmcweb.er.usgs.gov/carto_research. Outline. Objectives and Introduction

E N D
Automatic Generation of Parameter Inputs and Visualization of Model Outputs for AGNPS using GIS E. Lynn Usery Michael P. Finn USGS DoD Environmental Program Conference usery@usgs.gov mfinn@usgs.gov http://mcmcweb.er.usgs.gov/carto_research
Outline • Objectives and Introduction • GIS Databases for Parameter Extraction • AGNPS Parameter Generation • AGNPS Output Visualization • Resolution and Resampling Effects • Conclusions
Objectives • Develop GIS databases as input to Agricultural Non-Point Source (AGNPS) Pollution Model • Create a tool for generating input, executing the model, and analyzing output • Determine effects of resolution and resampling
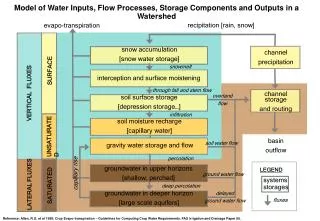
Introduction -- AGNPS • Operates on a cell basis and is a distributed parameter, event-based model • Requires 22 input parameters • Elevation, land cover, and soils data are the base for extraction of input parameters
Georgia Watersheds Agricultural areas with some woodland, wetlands, and small urban areas
Project Design • Assumptions • AGNPS parameters can be generated with GIS • Parameters are affected by resolution of GIS data • Hypotheses • Lower resolution cannot provide same parameters as higher resolution • Resampling GIS data degrades quality
GIS Databases for Parameter Extraction • National Elevation Dataset (30-m) • National Land Characteristics Data (30 m) • Augmented with recent Landsat TM data • Soils databases from USDA soil surveys • Scanned separates, rectified, vectorized, tagged • Resampled the 30-m data to 60, 120, 210, 240, 480, 960, and 1920 meters • 210-m roughly matches 10 acre grid size
AGNPS Parameter Generation • AGNPS Data Generator • Input parameter generation • Details on generation of parameters • Extraction methods
AGNPS Data Generator • Created to provide interface between GIS software (Imagine) and AGNPS • Developed interface for Imagine 8.4, running on WinNT/2000
Input Parameter Generation • 22 parameters; varying degrees of computational development • Simple, straightforward, complex
Creating AGNPS Input • Input Data File Creation • Format generated parameters into AGNPS input file • Use a “stacked” image file to create AGNPS data file (“.dat”) -- ASCII
Details on Generation of Parameters • Cell Number • Receiving Cell Number • SCS Curve Number • Uses both soil and land cover to resolve curve number
Details on Generation of Parameters • Slope Shape Factor
Details on Generation of Parameters • Slope Length • A concern; max value should be 300 ft. • Parameters 10, 11, 12, 14, 15, 16, and 17 • Uses Spatial Modeler to lookup attributes from soils or land cover • Parameters 13, 18, 19, 20, and 21 • Hard coded on advice from experts
Details on Generation of Parameters • Type of Channel • Uses TARDEM program • Creates a Strahler steam order
Extraction Methods • Used object-oriented programming and macro languages • C/ C++ and EML • Manipulated the raster GIS databases with Imagine • Extracted parameters for each resolution for both boundaries using AGNPS Data Generator
Creating AGNPS Output • AGNPS creates a nonpoint source (“.nps”) file • ASCII file like the input; tabular, numerical form
Creating AGNPS Output Images • Output Image Creation • Combined “.nps” file with Parameter 1 to create multidimensional images • Users can graphically display AGNPS output • Process: create image with “x” layers, fill layers with AGNPS output data, set projection and stats for image • Multi-layered (bands) images per model event
Creating AGNPS Output Images Red – Peak Flow Upstream Green – Upstream Runoff Blue – Overland Runoff
Creating AGNPS Images Red – Total Soluble Nitrogen Green – Sediment Attached Nitrogen Blue – Drainage Area
Results • Resolution effects • Tested with two independent collections • Elevation at 3 m and 30 m resolution • Land cover at 3 m and 30 m resolution • Comparison of values
Sampling of Points for Land Cover and Elevation Comparisons for Little River, GA
Regression Results • 3 m to 30 m comparison • Elevations -- R2 of 0.81 • Land cover – McFadden’s pseudo R2 of 0.139, meaning little correlation • Derived parameters, e.g., slope, problematic because of degraded data source
Results • Resampling effects
Experimental Approach • Analysis requires DEM, slope, and land cover at 30, 60, 120, 210, 240, 480, 960, 1920 m cells • Starting point is 30 m DEM and land cover • Calculate slope at 30 m cell size from DEM • Resample land cover • How to generate slope at 60 m and larger cell sizes? How to aggregate land cover?
Method of Calculation • Slope calculated from DEM • 30, 60, 120, 210, 240, 480, 960, 1920 m cells • Compute slope from 30 DEM • Aggregate DEM from 30 m to each lower resolution • Compute slope from aggregated elevation data
Sample of Slope Generation Approaches compute aggregate 30 m DEM 30 m slope 60 m slope aggregate compute 60 m slope 30 m DEM 60 m DEM aggregate compute 30 m DEM 120 m DEM 120 m slope 30 m DEM compute 30 m slope aggregate 120 m slope
Image Results -- DEM 30-480 m Pixels 210-480 m Pixels
Results -- Slope Slope % 30 to 480m Pixels 7.8816 7.8232 7.5870 7.8251 8.1604 8.5415 8.2065 7.9530 7.7434 7.7092 Slope % 210 to 480m Pixels 7.9514 7.8969 7.6244 7.7855 8.1263 8.5087 8.2157 7.8606 7.6390 7.6081 Regression Output: Constant 0.2762 Std Err of Y Est 1.1626 R Squared 0.7690 No. of Observations 500 Degrees of Freedom 498 X Coefficient(s) 0.8860 Std Err of Coef. 0.0218
Results -- Slope • Slope • Method of calculation affects results • Higher resolution aggregation directly to large pixel sizes yields better results than multistage aggregation (e.g., 30 m to 960 m is better than 30 m to 60 m to 120 m to 240 m to 480 m to 960 m) • Even multiples of pixels hold results while odd pixel sizes introduce error
Slope Image Comparison 30 m to 480 m pixels 210 m to 480 m pixels
Image Results - Land Cover 30-480 m Pixels 240-480 m Pixels
Image Results - Land Cover 30-210 m Pixels 120-210 m Pixels
Statistical Testing • Selected 500 random points over the watershed • Compared elevation, slope, and land cover values at the 500 points • Computed R2 and pseudo R2 between resolutions • Plotted R2 and pseudo R2 against resampled resolutions from 30 m data