Energy Efficiency @ Infosys
420 likes | 561 Vues
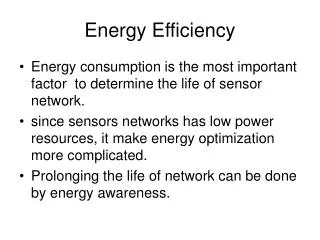
Energy Efficiency @ Infosys. The context…. Our Carbon Footprint. Misc . (13 million units) 5%. Air conditioning (106 million units) 40%. Mobility 34%. UPS (106 million units) 40%. Electricity 66%. Electricity . Employee commute 24%. Lighting / Raw power (40 million units)

Energy Efficiency @ Infosys
E N D
Presentation Transcript
Our Carbon Footprint Misc. (13 million units) 5% Air conditioning (106 million units) 40% Mobility 34% UPS (106 million units) 40% Electricity 66% Electricity Employee commute 24% Lighting / Raw power (40 million units) 15% Business travel 76% Mobility
Measure, Monitor & Control • You cannot control what you cannot measure ! • Installed over 1500 energy meters starting from 2008 to measure energy consumption of various energy consumption categories • Building incoming feeder • Chiller plant main panel, and further sub metering • Lighting/raw power panel • This was the starting point for energy efficiency measures in existing buildings
Energy efficiency in HVAC Energy audits were initiated Consolidated on the operating hours across locations Defined operating patterns of equipments Replacement of old equipments with poor efficiencies Chiller plant re-engineering to get them to highest efficiency standards Daily energy reports to the facility managers
Energy Efficiency in HVAC Existing Chiller plant details : Chillers: 4 X 250 TR = 1000TR Auxiliary Connected load : 298 KW Primary Pumps : 5 No’s Secondary Pumps : 4 no’s Condenser Pumps : 5 No’s CT fans : 4 no’s Re-engineered Chiller plant details : Chillers: 4 X 250 TR = 1000TR Auxiliary Connected load : 88 KW Primary Pumps : 4 No’s Condenser Pumps : 4 No’s CT fans with VFD : 4 no’s Chiller plant re-engineering – a case study
Energy Efficiency in Lighting Occupancy sensors in rest rooms, cabins LED lights in WCs (replacing CFL) LED street lights (replacing HPSV) Lighting energy savers on the panels Astronomical timers for street lighting LEDs for corridor lighting (replacing CFL)
Impact of Energy Efficiency Initiatives to the bottom line Increased by 18% 23% improvement Energy consumption for 2011-12 is estimated at 205 units/emp/month
Integrated design approach Efficient building design Efficient lighting Efficient air conditioning Efficient control system for operation ECBC as the baseline
Day Lighting in Buildings: Trivandrum Trivandrum SDB 1 building with high performance glazing shaded externally Artificial lights are not required during daytime.
8X saving in operations cost– Trivandrum SDB 1 Simulations for optimization LED replacing CFLs Day lighting sensors
300% improvement in Lighting design 2X reduction in the installed lighting load ~3X reduction in lighting energy consumption
HVAC Design optimization process Goal To maximize energy efficiency in building HVAC system through design interventions Step 1 • Prevent heat coming into the building as much as possible Step 2 • Design efficient system to maximize energy efficiency Step 3 • Select high efficiency equipments to further maximize energy efficiency
Heat loads – Heat Sources 1 Fresh air Roof Lights 1 24 0C 1 Glass People Equipment Walls 35 0C
Building Envelope: Insulation Wall (5X) Roof (13X) RCC roof 45 0C 24 0C 35 0C Plain Brick wall 24 0C 55 Watts 24 0C 35 0C 22 Watts Insulated RCC roof 4.4 Watts 35 0C Double brick wall with insulation 24 0C 4 Watts
Building Envelope: High Performance glazing (5.8 X) Solar Thermal Far Infra Red Near Infra Red Near Infrared Far Infrared UV Visible .25 .38 .78 2.1 2.60 50 microns Spectrally selective double wall glass with Argon filling Single glass 900 W 900 W 24 0C 35 0C 24 0C 810 W 360 W 540 W 90 W 35 0C 55 W 12 W
Case Study: Building in Mysore (1.8 X) No additional cost
Advanced Cooling Technologies Specific heat of water 4.2 kJ/kg deg K Density of water 1000 kg/m3 Specific heat of air 1.0 kJ/kg deg K Density of air 1.25 kg/m3 Water can store 3,400 times more thermal energy per unit volume than air! Water Vs Air as heat transfer medium
66% energy savings: Alternative cooling strategies • Highly insulated building • Evaporative cooling • Heat recovery wheel/Free Cooling • Radiant cooling/Chilled beams • Building management software • Very efficient equipments 200mm 150mm Outside inside Double brick wall with insulation 24 0C 35 0C 4.4 Watts Radiant cooling pipes embedded in the slabs
Design Vs Actual Efficiencies Smart buildings – actual data Design Vs Actual Efficiencies Benchmarking
300%Improvement in air-conditioning design • Figures based on actual measured data in Hyderabad climate for Apr 2011 – Feb 2012 • 3X improvement in efficiency compared to 2007 design • Radiant cooling at no additional cost
Green Building Certifications LEED Platinum rating for BPO-1, Jaipur LEED Platinum rating for SDB-1, Trivandrum LEED Platinum rating for SDB-5, Mysore LEED Platinum rating for SDB-1, Hyderabad BEE 5-star rating for BPO-1, Pune All new buildings of Infosys since 2008 have been registered for Green Building rating – LEED / GRIHA
Redefining the standards Building envelope heat load not to exceed 1.0 W/sqft More than 75% of the office area to be naturally lit as per LEED standards Breaking the barrier………….. > 550 sqft per TR of AC area < 0.4 W/sqft for lighting design < 0.5 kW/TR for chiller plant design < 3.5 W/sqft for electrical design
Experiences / Conclusions Set unreasonable targets Efficient buildings do not cost more, but need a little effort at the right time. All Infosys buildings exceed ECBC efficiency requirements. Good design = job half done ! Question all assumptions and get the sizing right Select right sized efficient equipments and smart controls Measure, monitor……..Measure, monitor………..feedback…. Seeing is believing……………Welcome to Infosys.
Thank you Guruprakash Sastry Senior Manager – Green Initiatives | Infrastructure Infosys Limited Bangalore 560 100 Tel: +91 80 39148650 M: +91 97399 76191 Email: guruprakash_sastry@infosys.com